🔥MASSIVE MOVE IN SILVER LOOKS IMMINENT🔥
💥Silver Will Give Us the Answer Within 7 Days‼️
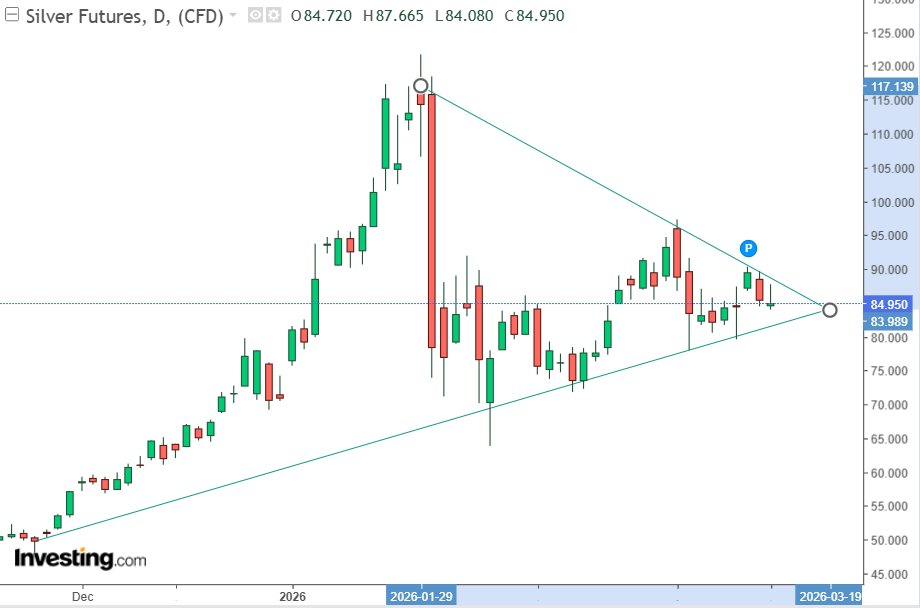
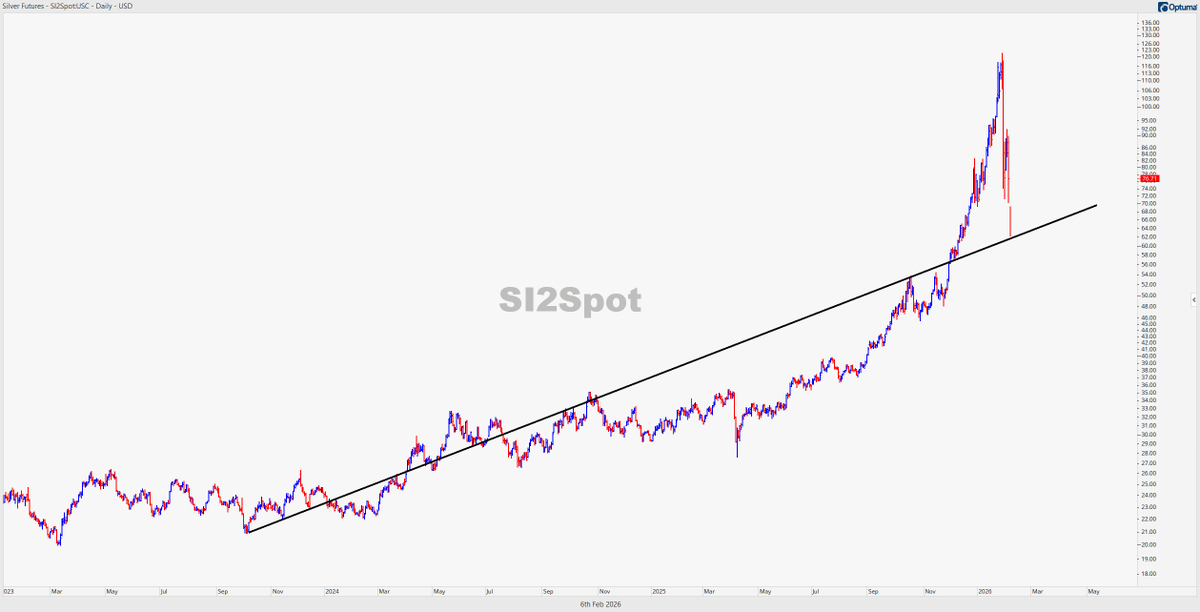
Silver's HUGE wedge formation is nearing completion. ⚡️A breakout likely sends us back to all-time highs & beyond ($150-$170 likely)
📉A breakdown likely sends us back to retest the entire breakout from the 50 year cup-and-handle formation.
Silver's consolidation is nearing completion.
A MASSIVE MOVE looks to be imminent:
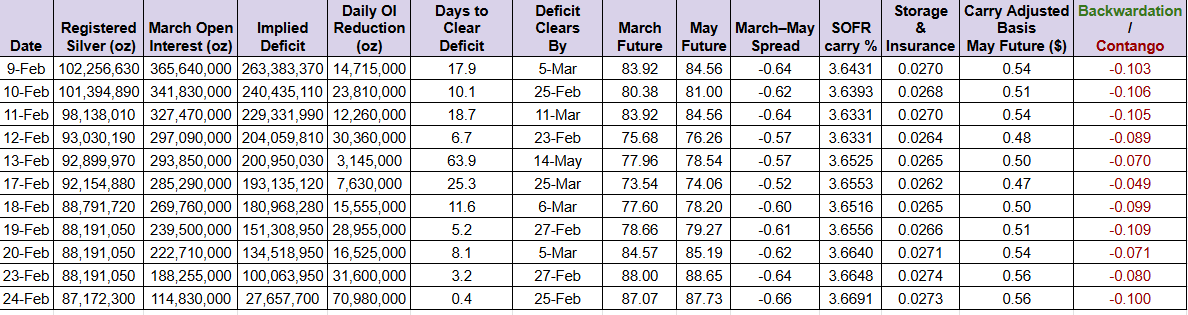
Silver backing futures keeps falling and is now 87.2M oz.
Key takeaway from Tuesday’s close:
71 million ounces were rolled yesterday, and everyone who called force majeure now has to admit it will not happen in March.
What stands out is the complete absence of new metal coming in, and the longer that continues, the better silver will perform.
Silver just touched $91.14, which is above the 50-day moving average ($83.52). Since May 30, the 50 MA has not declined, which shows how strong the uptrend is.
The reason I started building this table is that I think silver will trade above $120 later in 2026. The driver will be that silver demand proves to be larger than supply. You can track that by watching how much silver is backing the futures market.
I expect that number to keep falling. Then we will see the March-May spread, or later the May-July spread, flip from contango to backwardation. After that, I expect the outflow from COMEX to accelerate.
Then retail investors will realize that the spike to $120 was not a one-off move. They will start buying ETFs, which removes more physical silver from the market. After that, the market will realize that if you pay enough, there is always silver from mining, and that is when silver mining stocks can go vertical.
This is obviously not a guarantee, and that is exactly why this simple daily table is so useful: it shows whether my path is still unfolding or not.
Date: Trading day of the snapshot.
Registered Silver (oz): Silver in COMEX vaults that is warrant-issued and available for delivery against futures.
March Open Interest (oz): Open interest in the March contract converted to ounces (contracts × 5,000 oz).
Implied Deficit (oz): March open interest (oz) minus registered silver (oz).
Daily OI Reduction (oz): The day-over-day decline in March open interest (in ounces).
Days to Clear Deficit: Implied deficit divided by Daily OI Reduction. A rough estimate of how many trading days it would take for the deficit to disappear if the current roll pace continues.
Deficit Clears By: The calendar date implied by “Days to Clear Deficit” (projected forward from the current date).
March Future: Settlement/close price of the March silver futures contract.
May Future: Settlement/close price of the May silver futures contract.
March–May Spread: March price minus May price.
SOFR carry %: The annualized financing rate (SOFR) used to estimate the interest component of carry between March and May.
Storage & Insurance: Estimated storage + insurance cost for holding silver from March to May, expressed in $ per oz.
Carry Adjusted Basis May Future ($): Total estimated carry cost between March and May (financing + storage/insurance), expressed in $ per oz.
Backwardation / Contango: A carry-adjusted signal. It compares the March–May spread to total carry. If this flips from contango to backwardation, the market is effectively saying: “I don’t care what the paper price is. I need physical silver. And I need it now.”
There is a lot of talk that silver will be slammed when the Shanghai Exchange is offline for the Chinese New Year. So, I have collect the loss/gain data for the last 10 years. History is not indicative of future results, but the average over the last 10 years is a +0.876% increase in the silver price during CNY.
Here's the breakdown:
2016: 6.99%
2017: 2.55%
2018: -0.43%
2019: -0.32%
2020: 1.15%
2021: -3.36%
2022: 1.48%
2023: 0.30%
2024: -1.29%
2025: 1.69%
Trump's Federal Reserve chairman-designate will not be able to stop the bull market in gold:
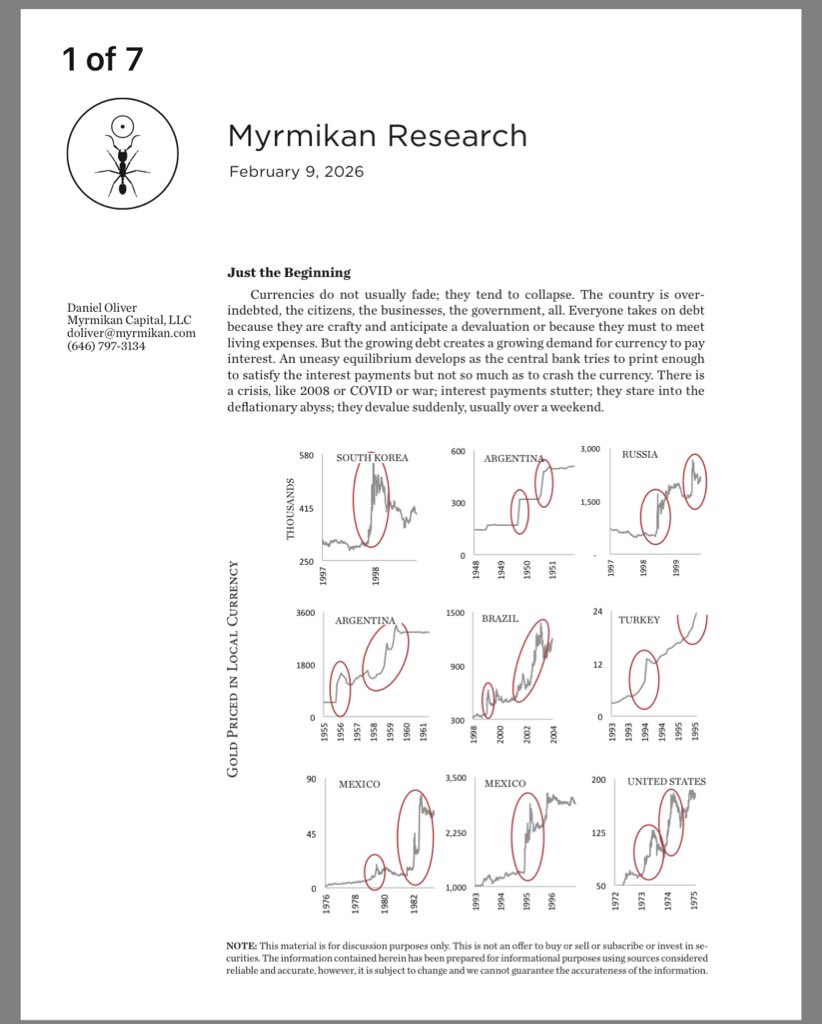
Myrmikan Research note argues that currencies do not typically decline gradually but instead collapse abruptly once excessive debt undermines confidence, a process that has repeated across history in countries ranging from Weimar Germany to Argentina, Turkey, Russia, and Mexico.
It explains that over-indebted governments, corporations, and households borrow more not out of optimism but out of necessity or anticipation of devaluation, creating a fragile equilibrium in which central banks attempt to print just enough money to service interest obligations without triggering a loss of confidence.
This equilibrium eventually fails when a shock such as war, financial crisis, or systemic stress disrupts debt servicing, forcing sudden currency devaluation, often over a very short time frame.
Gold priced in local currency, as shown through multiple historical charts, consistently acts as an early warning signal of this collapse, becoming increasingly volatile as the pace and acceleration of monetary debasement intensify.
It emphasizes that the current gold bull market differs fundamentally from past inflation-driven episodes because it began not with domestic U.S. economic distress but with an external geopolitical rupture in February 2022, when the United States froze Russia’s dollar reserves and thereby exposed the political risk embedded in holding dollar-denominated assets.
This action triggered a quiet but persistent shift by central banks, sovereign wealth funds, insurance companies, and other large balance-sheet holders away from U.S. Treasuries and dollar assets and toward gold, the only non-dollar asset liquid enough to absorb such flows.
From late 2022 through early 2026, gold’s steady parabolic rise reflects this growing institutional demand rather than retail enthusiasm or inflation panic.
Myrmikan argues that the U.S. dollar’s reserve status is increasingly sustained by inertia rather than genuine global acceptance, noting that neither geopolitical rivals nor even U.S. policymakers fully support the burdens associated with reserve currency dominance.
The international dollar system has allowed the United States to run persistent trade and fiscal deficits while attracting foreign capital to finance excessive leverage across the financial system.
As foreign demand for dollar assets weakens, the paper warns that this external stress will translate into an internal financial crisis marked by rising funding costs, with private equity & private credit markets identified as the most vulnerable points due to their dependence on cheap and abundant liquidity.
The Federal Reserve, the authors argue, lacks effective tools to resolve such a crisis without further destabilizing the currency.
It casts serious doubt on feasibility of any attempt to simultaneously lower interest rates, shrink Fed’s balance sheet, and finance large-scale U.S. reindustrialization, concluding that political & market pressures will ultimately force renewed and accelerating monetary expansion.
The Three Phases of the Gold Endgame
Myrmikan outlines a three-phase monetary unwind:
Phase 1 (Current)
•External de-dollarization
•Gold rises steadily, institutions remain underinvested
•No visible domestic crisis yet
Phase 2 (Next)
•Fed forced to monetize more aggressively
•Inflation resurfaces domestically
•Bond market loses credibility
•Gold reflects Fed impotence
Phase 3 (Terminal)
•Sovereign debt death spiral
•Rising yields → rising deficits → forced monetization
•Choice between default or currency destruction
•Historically, this always ends in collapse
Myrmikan avoids near-term calls but provides balance-sheet logic:
•Historical gold backing: 33%–50% of central bank assets
•That implies gold between $8,400–$12,600/oz
•Panic scenarios can briefly push gold toward 100% backing
https://t.co/kftf5qLOjL
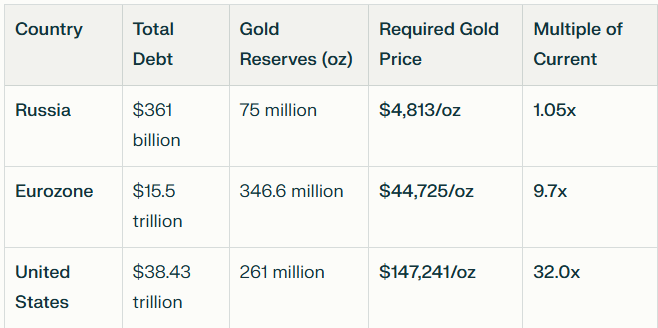
Gold prices needed to wipe out all federal debt:
- Russia: $4.8K
- Eurozone: $44.7K
- United States: $147K
Rising gold prices can solve global debt problems,
as a rise in prices doesn’t hurt any industry.
- No factories shut down because gold goes up.
- No inflation
- No crisis
Just gold prices rising significantly
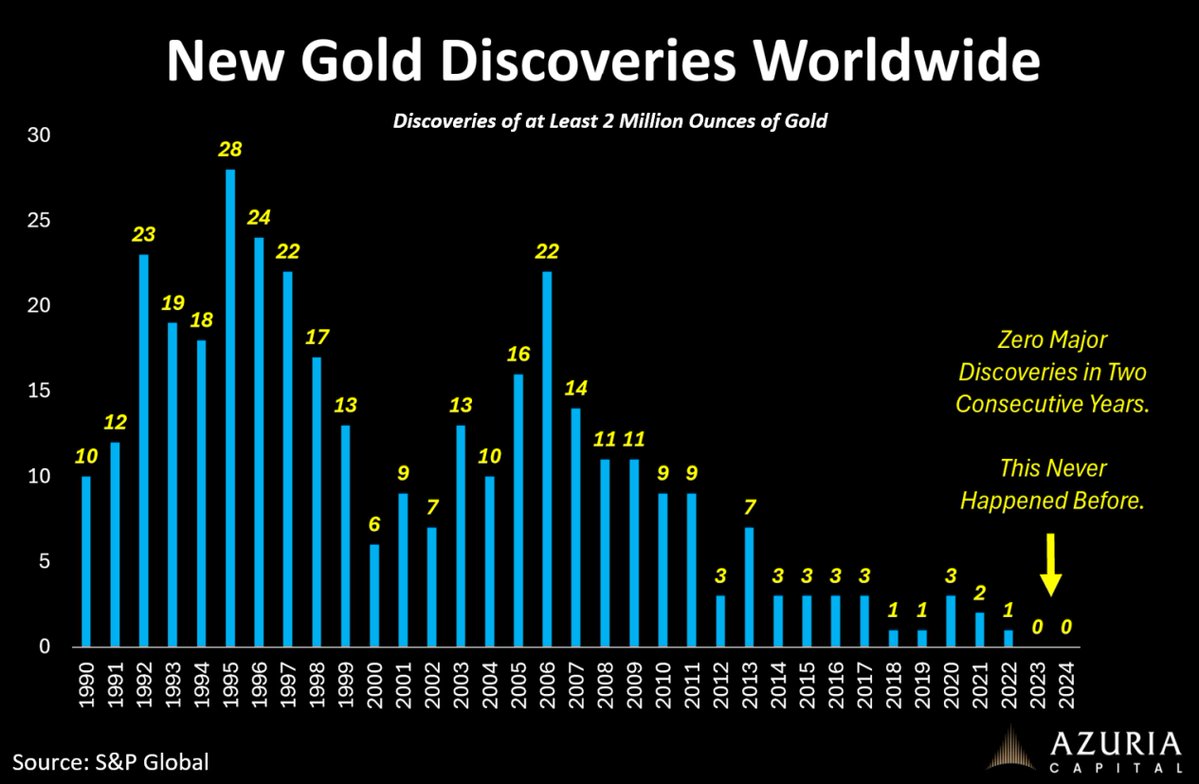
For the first time in recorded history, global data show zero gold discoveries in two consecutive years.
This has never occurred before.
And this is not unique to gold.
Major discoveries across most metals have fallen into the single digits, with no meaningful projects in the pipeline capable of materially altering the global supply curve.
This is the real barometer of where we are in the mining cycle.
Still early.
@GettingWell4 I’m surprised that $PSLV can be picked up at a discount. Right now it’s about 2.7%, whereas in 2011 and 2012 you had to pay a huge premium to the silver price.
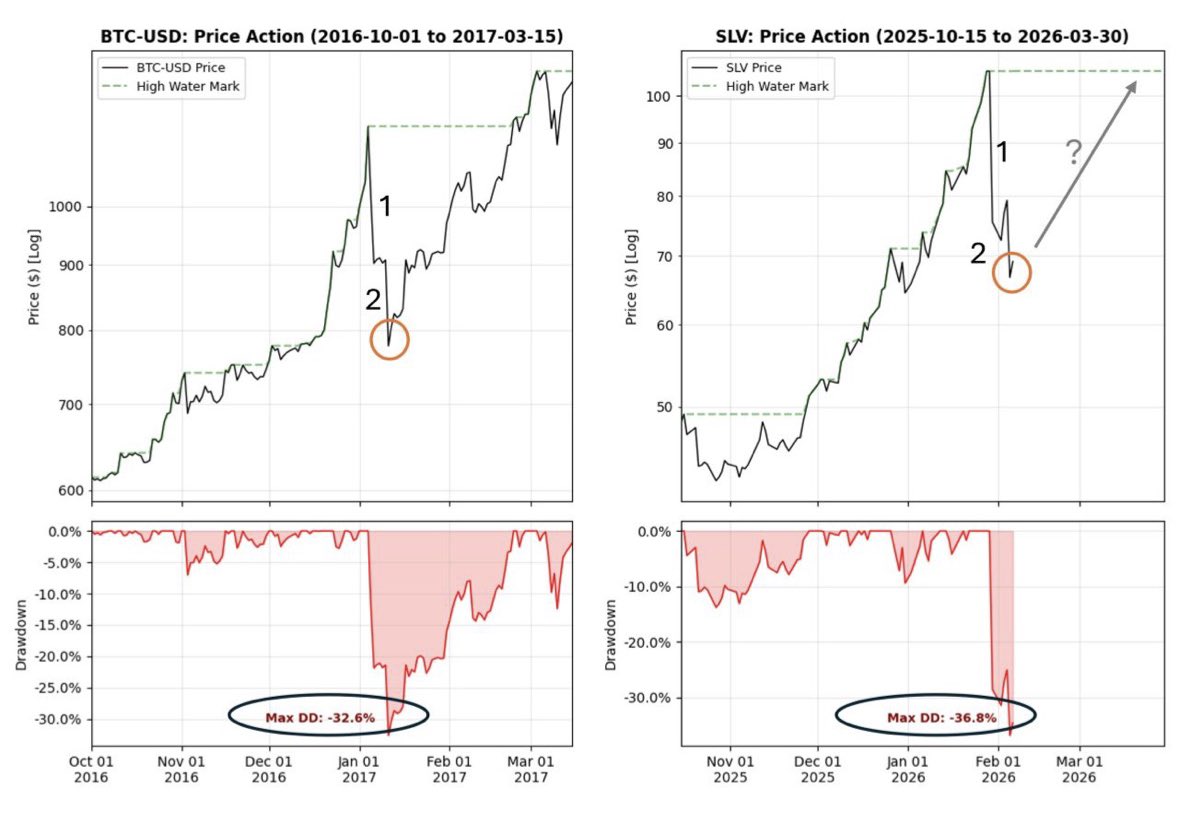
Silver bottom most likely in.
Thursday appears to have been the "second shoe to drop", a final shakeout to clear sentiment before the bull market continues in precious metals.
This similar fractal occurred in BTC in Jan 2017, as can be seen below. BTC recovered in 1.5 months and went on to much greater highs that year.
If we see similar price action in silver, it would imply new all time highs by mid-March.