Financial Markets | Global Economic Trends
I post daily awareness on Market structure for free
All my posts are to be taken for Educational purposes only
My objective of this X page is to share my post trade analysis on why I had entered & exit a certain trade through Technical analysis on most of the time. I take fundamentals where matters.
All my trades analysis are to be taken as educational and research purposes, I don’t give any kind of pre-calls whatsoever.
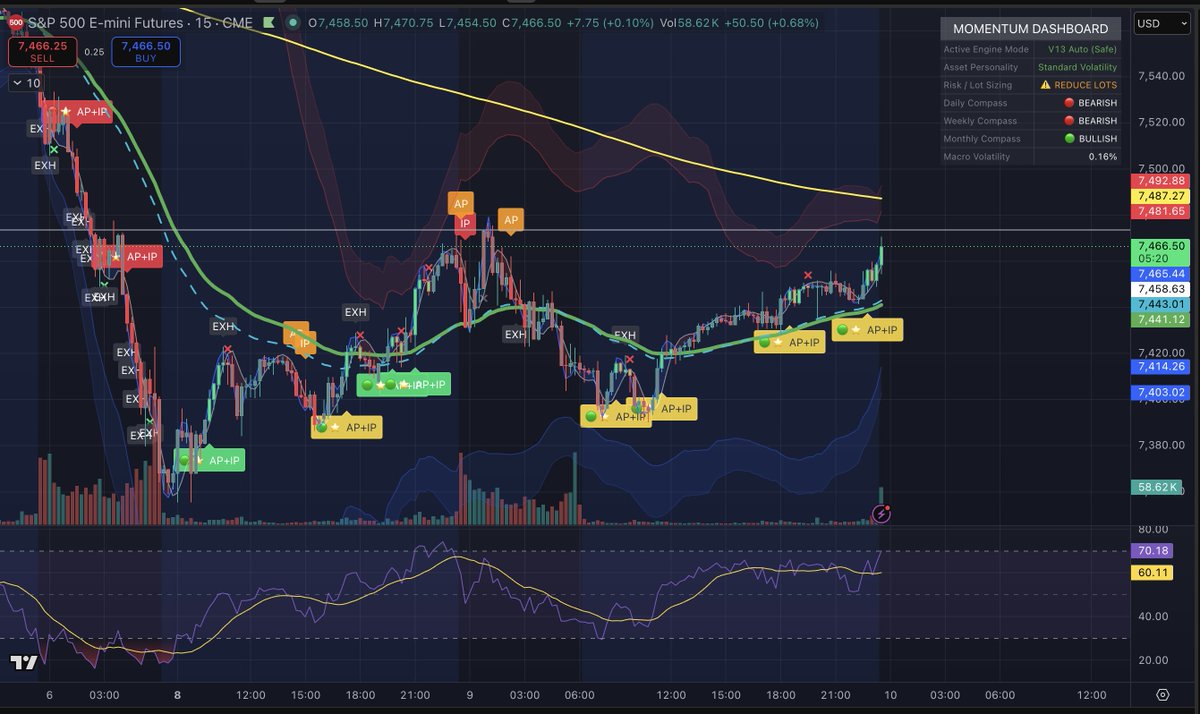
Bearish for tomorrow $SPY $SPX $ES
SPY closed at 739.2$ on 8th June.
Let’s see what holds tomorrow. We have key levels to watch that can flip either regime.
@AshCrypto We knew BTC reached 60% exhaustion point as of last Friday and was due for some rebound, permanent rebound is not confirmed yet. https://t.co/9tGEa7mRUT
$MSTR $BTC
Did my part.
We saw BTC selling has reached 60% exhaustion levels by institutions and predict some breathing on BTC and MSTR.
It’s a high risk process trade and we have only risked the fraction amount of liquidity we put into it.
Bought into post market price.
This meme recollects me to few years back, when similar meme was circulating that people who bought BTC at ATH of 60k something. And then BTC dropped more than 60%.
Then it had surged to double the ATH of 120k plus.
Either this meme circulating should represent fear is at the peak, and bottom is signalling, or it could dip few more. History should teach investors a good lesson
$ES $SPX $SPY
ES has nicely printed out of more than 700% on the 6800P strike price since the bought position price.
The entry logic as seen from price action, we had a nice clean visual of when downtrend momentum has started in the 1H timeframe.
This is confirmed from stage 2 flow of institutions.
All this you got for free, and you have one job; is to follow us.