Excellent question. Weather balloon tech could should be updated and automated so it's reliable and consistent .....and putting a tiny effort into it would preserve info and save lives @NWSSPC
The lack of morning weather balloons launched across the western and central U.S. is having a real, tangible impact on degrading forecast quality.
We can't look at weather balloon data that doesn't exist. We can't pump nonexistent data into models. We can't rely as heavily on models that don't "know" what's happening above our heads.
Today's severe weather forecast is less certain because we don't have weather balloon data to confirm the strength of jet stream winds aloft.
This is extremely frustrating, and is the result of logistical, organizational, political and budgetary decisions.
Hey independent weather streaming friends--- if there's severe weather - you're live on camera… But if the weather is lovely and your viewers still want to see Weather… Check out today's launch of "Sowers Skywatch" It's the future of hyper local access personalized for you by an authentic weather expert (I tried to talk him into changing his last name to showers when we work together in Chicago. True story.) https://t.co/zrkmnLsAOo
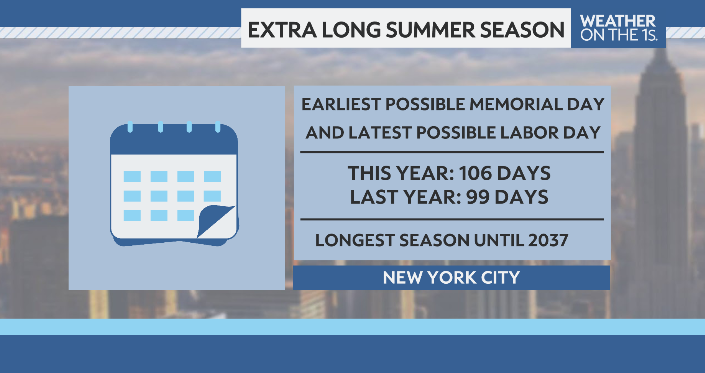
Longest summer season until 2037. Quirk of the calendar means earliest Memorial Day and latest Labor day possible. 106 days of the summer season. Last year is was 99 days.
NYC weekends really do feel rainier... I ran more data and built a full data investigation to see if the pattern is real.
Across 2,192 days (6yrs now!) of weather data, NYC rain rates by day of week look like this:
Mon: 27.8%
Tue: 32.9%
Wed: 31.8%
Thu: 34.5%
Fri: 38.0%
Sat: 35.8%
Sun: 32.3%
Friday is the rainiest day of the week.
You are not imagining it.
The interesting part is the possible chain reaction behind it.
NYC’s PM2.5 air pollution appears to peak midweek, with Wednesday averaging 8.5 µg/m³, roughly 23% higher than Sunday’s 6.9.
Those particles can act as cloud condensation nuclei, which may help clouds form and intensify under the right atmospheric conditions.
With a 2–3 day lag, that points to a plausible pattern:
Midweek pollution buildup → late-week cloud formation → Friday/Saturday rain risk.
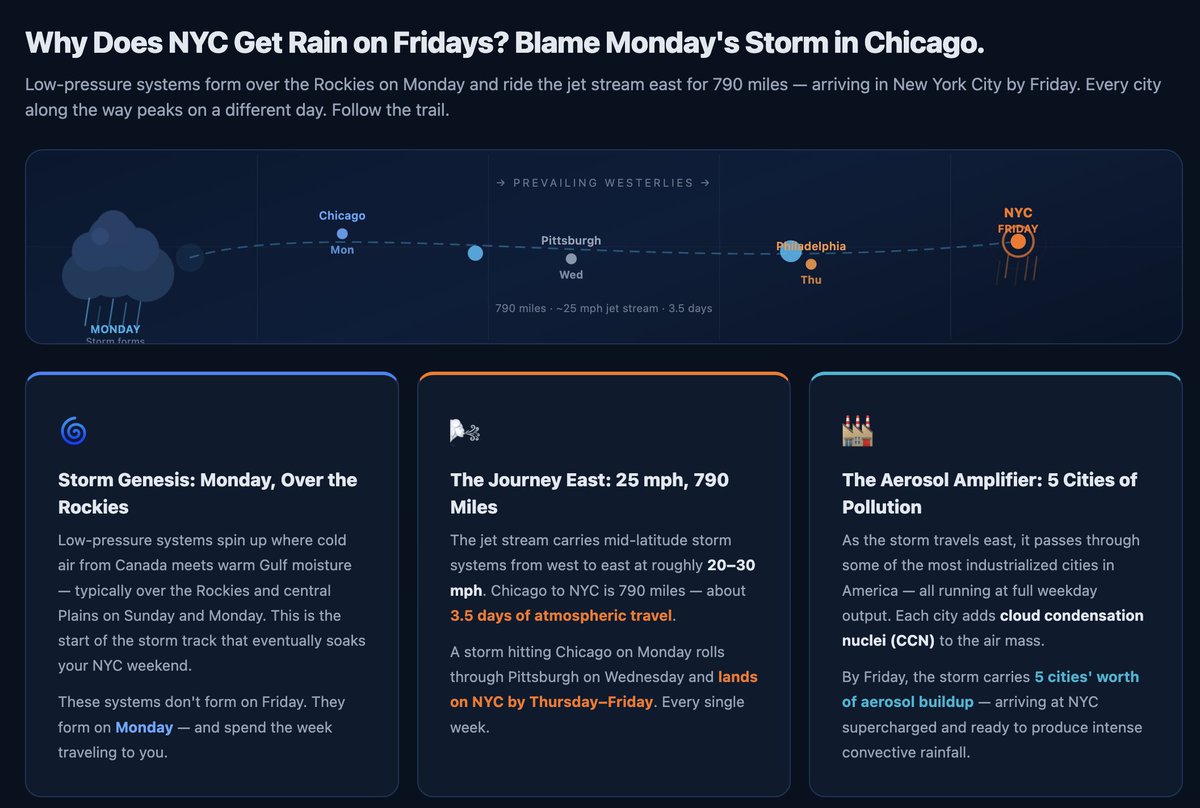
But the weather does not start in NYC.
Storm systems often form or organize farther west, then move east with the prevailing flow. In the data, the rain pattern appears to travel city by city:
Chicago: Mon, 33.2%
Pittsburgh: Wed, 34.1%
Philadelphia: Thu, 35.2%
NYC: Fri, 38.0%
The storm track takes roughly 3.5 days to travel about 790 miles.
Which means it can arrive in New York right as the weekend begins.
NYC also is not only dealing with its own emissions. A meaningful share of its PM2.5 can come from upwind sources.
The I-95 corridor, including Philly, Trenton, Newark, and surrounding metro areas, sits directly southwest of NYC, which matters because prevailing winds often move pollution northeast.
In other words, NYC may be the end of the pipeline.
One of the most interesting signals came from COVID.
During lockdowns, the weekly pollution rhythm weakened sharply as traffic collapsed. With far fewer vehicle crossings and less commuter activity, the normal 7-day aerosol cycle became much less pronounced.
When traffic came back, the pattern returned.
That does not prove tailpipes alone are making it rain every weekend. Weather is complicated. But the data suggests a real and testable relationship between traffic, pollution, atmospheric particles, storm timing, and late-week rainfall.
The thesis:
Our weekly human activity cycle may be helping shape NYC’s weekly rain cycle.
Full interactive dashboard with 2,192 days of data, animated storm tracks, and live charts:
https://t.co/m4dpRvXoXo
This is a chilling, eerie map – it depicts all the tornado emergencies to ever be issued in the United States... including Thursday night's.
On Thursday night, southeast Enid, Oklahoma found itself under a tornado emergency.
Tornado emergencies are the most urgent, life-or-death alert that the National Weather Service can issue. In the past 27 years, there have only been 316 tornado emergencies issued.
The National Weather Service in Norman, Okla. issued a tornado warning for central Garfield County in northern Oklahoma at 7:59 p.m. At 8:13 p.m., they warned that “a confirmed large and extremely dangerous tornado was located near Vance Air Force Base, moving east at 25 mph.”
The agency upgraded to a dire tornado emergency at 8:21 p.m. based on realtime video from local news stations. Tornado emergencies are only issued for the most high-end, life-or-death situations.
“You are in a life-threatening situation,” wrote the Weather Service. “Flying debris may be deadly to those caught without shelter. Mobile homes will be destroyed. Considerable damage to homes, businesses, and vehicles is likely and complete destruction is possible.”
Tornado emergencies are reserved only for anticipated catastrophic, high-end tornadoes – intense-to-violent EF3, EF4 and EF5 monsters on a crash-course with population centers.
On April 27, 2011, there were 37 of them issued. THIRTY SEVEN.
The tornado emergency was invented on May 3, 1999, when a mile-wide F5 tornado was barreling up the H. E. Bailey Turnpike into the Oklahoma City metro area. Forecasters knew that dozens would perish, and that entire neighborhoods would be obliterated. At the National Weather Service in nearby Norman on the University of Oklahoma campus, the warning meteorologist on duty felt a run-of-the-mill tornado warning wouldn't cut it. Their 6:57 p.m. message reflected it.
The warning began “tornado emergency in south Oklahoma City,” the phrase “tornado emergency” never having been used before. The pioneered phrasing is now reserved only for the most significant events with the highest fatality potential, famously being issued on May 20, 2013, as another EF5 tornado barreled into Moore. (Joplin, Missouri SHOULD have been a tornado emergency, but infamously wasn't.)
This tornado season, take ALL tornado warnings seriously – but, if you find yourself in a tornado emergency, know what it means. If you hear the phrase "tornado emergency," know that the decisions you make in the following 5, 10 or 15 minutes will determine whether or not you survive.
Have you ever been in one?
🌪️ In case you missed it—tornado confirmed in northern Utah
The National Weather Service has officially rated the Logan Canyon (just west of Bear Lake) storm as an EF-1 #tornado. Peak winds were estimated around 100 mph, with a path stretching roughly half a mile and a width near 100 yards. 🌪️
No injuries reported, but the damage tells the story—plenty of trees snapped and taken down along the path. 💨
Alright… Colorado State just dropped their 2026 hurricane forecast—and they’re going with slightly below normal: Thirteen named storms. Six hurricanes. Two majors.
Clean. Conservative. And just an early call and as we know – – seasonal forecast are never black-and-white!
No question CSU's ENSO driven forecast holds water – – (how warm is that water?!)
El Niño vs Warm Atlantic in a tug-of-war -- consider the possibilities.
They’re betting on El Niño—which, yes, historically increases vertical wind shear over the Atlantic. Translation: storms try to build, and the atmosphere basically says… "we aren't playin' - not today."
We’ve seen this before—2015, strong El Niño, suppressed Atlantic season.
Science checks out. ✔️
...here’s where you raise an eyebrow to a below average forecast based on the non deterministic Enso:
El Niño isn’t fully developed yet.
And seasonal models right now? They’re not exactly in lockstep.
So this forecast is doing a lot of heavy lifting on something that hasn’t fully shown up to the party.
And let me remind you—
1992 was a ‘quiet’ season… and then came Hurricane Andrew.
So don’t get comfortable with the word ‘below normal.’ (i'm pretty confident that Phil and all Mets would also say this!)
Because the atmosphere doesn’t care about averages—it cares about timing.
One break in the wind shear… one warm pocket of water…
and suddenly, it’s game on.
Bottom line?
Smart forecast. Solid science.
But confidence? Not exactly a slam dunk. We still need to do everything we normally do to prepare for hurricane season – – because hurricane season loves to humble everyone.
CSU's April 2026 seasonal #hurricane forecast press release has been translated into Spanish:
https://t.co/vNZZrsK8AV
Thanks to @Delian_wx and @NicholasAMesa1
for the translation!
Oh Joe! I love a good headline
🥶 "MAY FREEZE!" 🩵 This almost makes me want to do TV at 4:30am... But I stand by my fashion suggestion! As you know - we’re getting into the time of year where cold air has a hard time holding its ground. Even if we see a few cool swings, the atmosphere is working overtime to warm things back up. Your enthusiasm is always fun... and while some intraseasonal signals suggest variability ---the dominant late-April climatology, lack of strong blocking, and weaker spring teleconnections favor a trend toward near to above normal temperatures, with only brief, moderated cool shots. Here are some fun maps that support: (I made you a video!)
🌞 Seasonal forcing is overpowering
🌊 MJO is weaker in spring
🧊No clear blocking = no sustained cold
🌎 SOI is not a short-term trigger
🌡️ Air masses modify fast this time of year
=Cool swings? Yes.
Major cold wave? Not likely.
Your favorite hoodie will do, back to you!
It was the final freeze of the season in NYC - yes, permission to put away puffy coats... The jet stream is changing and now the heat builds from west to east (already record warmth in the Southwest! And 90s are targeting Florida!) what I'm trying to say is closet turnovers can commence! (Yes, New kicks, no creases yet.) 🩷