Ten years after Brexit, the final whistle has blown.
Did Britain become richer, stronger and more sovereign — or poorer, weaker and less influential?
Brexit at 10 tests the promises against the data.
No slogans. Just the score.
https://t.co/Pg0dWOFbTf
What would make a defence spending comparison useful to someone judging strategy?
The headline totals matter, but they need an account of what the money delivers. Is equipment available for operations? Are programmes meeting their milestones? Can forces perform their assigned tasks?
Our US–China Power Brief argues for clearer reporting on delivery and a careful distinction between new commitments and money already spent.
A dollar ratio cannot answer those questions, and a single year's budget movement cannot predict the outcome of a conflict.
Read the full analysis on The League of Nations website.
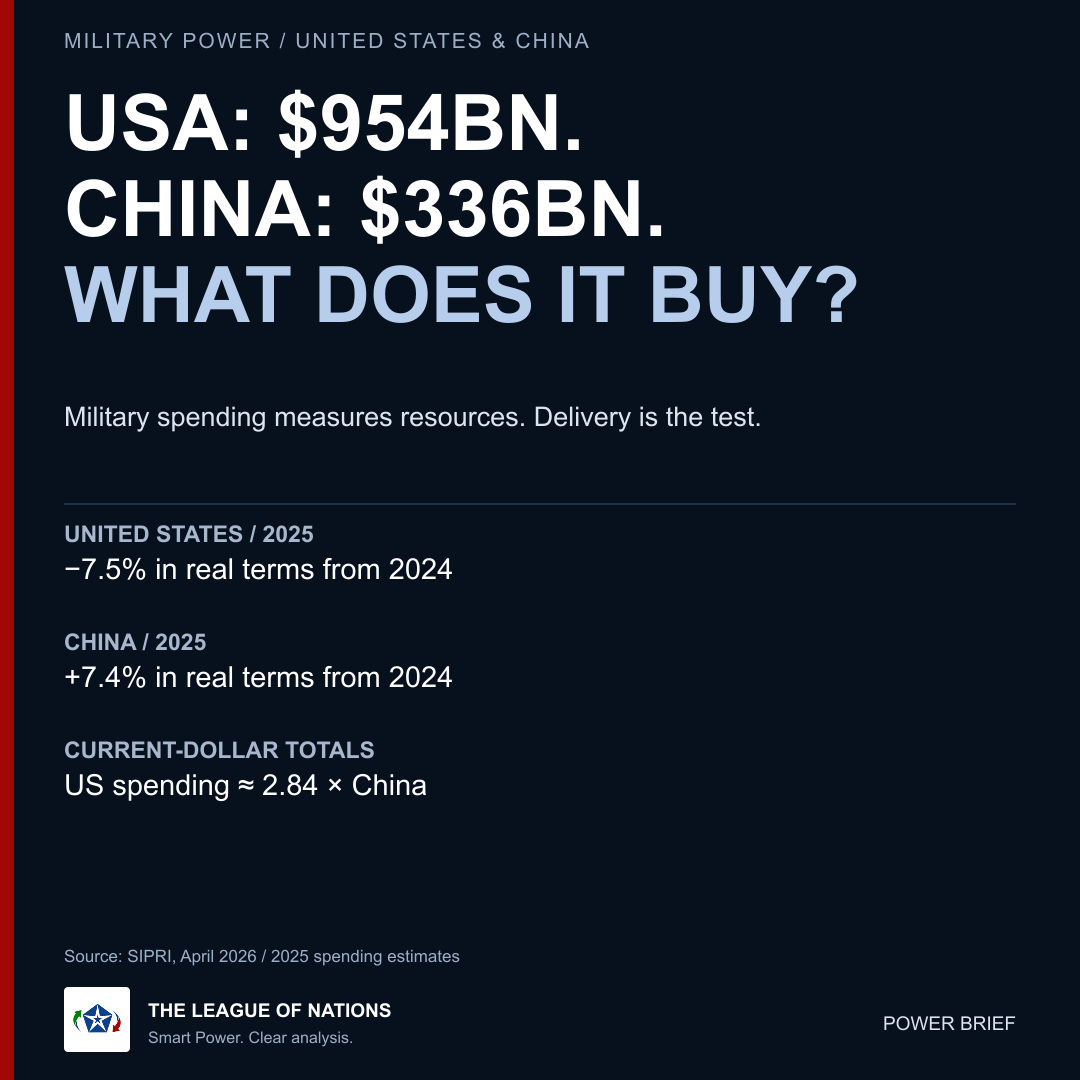
America still spends far more on its military than China. The 2025 figures also show two different directions.
SIPRI estimates US expenditure at $954 billion and China's at $336 billion. In real terms, US spending fell 7.5% from 2024; China's rose 7.4%.
The US current-dollar total was about 2.84 times China's. That ratio is not a measurement of combat power.
An annual budget cannot tell us how much equipment is operational, how quickly it can be replaced or whether procurement is delivering the forces a strategy requires.
Our new Power Brief asks what a meaningful performance test would look like. The answer starts with delivery milestones and accountability for results, alongside a clear distinction between budgets approved and money actually spent.
Read the full analysis on The League of Nations website.
What would you put beside the headline GDP number?
Our Britain–India Power Brief argues for evidence about investment, completed infrastructure and productivity. Those measures help test whether a growth strategy is improving the economy beneath the ranking.
A narrow lead in current dollars is an observation to explain. Currency conversion and revised national accounts matter to that explanation.
The harder task is to identify what has improved in practice—and what still needs to be delivered.
Read the full analysis on The League of Nations website.
Which economic measure answers the question you actually care about?
A current-dollar GDP total describes the size of an economy at prevailing prices and exchange rates. It does not, on its own, show whether living standards are improving or workers are becoming more productive.
Our Britain–India Power Brief explains why a narrow dollar lead needs that context. It then asks a practical question: what has Britain's industrial strategy delivered?
The proposal is a quarterly delivery account, judged against a clear baseline rather than a headline rank.
Read the full analysis on The League of Nations website.
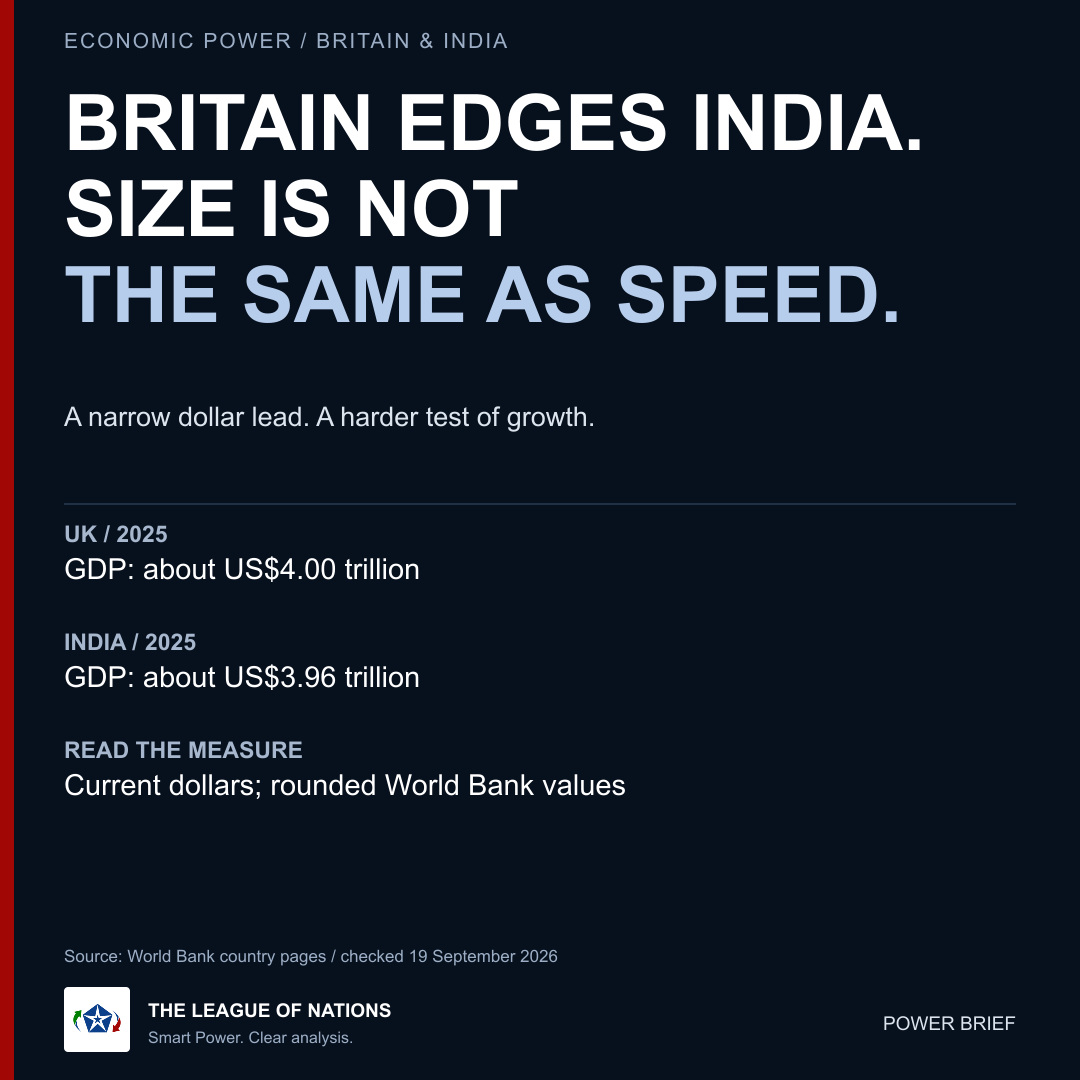
Britain edges India in the latest World Bank dollar GDP figures. That does not settle which economy is performing better.
The rounded 2025 totals are about US$4.00 trillion for the UK and US$3.96 trillion for India. This is a comparison of economic size expressed in current dollars. Currency movements and revisions to national accounts can change the order.
They do not automatically tell us whether households are better off or businesses have become more productive.
That is the distinction in our new Britain–India Power Brief. Britain's industrial strategy should be judged by investment delivered and productivity improved. India's statistical revision should be understood before a lower dollar rank is described as economic failure.
A useful comparison puts the headline total next to the evidence about how an economy works.
Read the full analysis on The League of Nations website.
What makes an alliance dependable when its members disagree?
Our Greenland analysis argues that a response to pressure should be agreed before the next emergency. Governments need to know the threshold, the available measures and who has responsibility for acting.
That also means specifying a way back to cooperation. A policy that can escalate but cannot de-escalate leaves an important part of the work unfinished.
Revisit the Greenland Power Brief on The League of Nations website.
A policy is only useful if governments know how to carry it out.
That is the question behind our Greenland Power Brief: what should trigger a European response to coercion, who should decide, and which measures can actually be delivered?
The additional tariffs threatened in January were withdrawn before taking effect. The lasting issue is whether the next confrontation would find Europe better prepared.
Our proposal combines clear responsibility with proportionate measures and a route to de-escalation.
Read the full analysis on The League of Nations website.
The Greenland tariff threat ended. The test for Europe remains.
In January, Trump threatened additional tariffs on eight NATO allies unless the US could buy Greenland. He withdrew the threat before the tariffs took effect. That distinction matters.
The strategic question is what Europe does when pressure comes from the ally on which much of its security depends. An emergency meeting can register opposition. A credible policy must explain what happens when the same tactic is tried again.
Our Power Brief argues for a standing response: agreed triggers, clear responsibility and proportionate countermeasures that governments can actually deliver. The purpose is to make coercion less attractive while keeping cooperation possible.
Defence spending belongs in that argument, but a larger budget is only a starting point. Procurement, readiness and the ability to act together determine whether money becomes useful power.
Read the full analysis on The League of Nations website.
China was viewed more favourably than America in 25 of 36 countries surveyed by Pew this year. The US led in six.
That is not universal legitimacy. It is diplomatic momentum—and Washington is running out of room to treat prestige as performance. More via @britinfluence.
The diplomatic scoreboard has moved.
China scores 97.7 for diplomatic influence in Asia. America scores 82.7. Pew now finds China viewed more favourably than the US in 25 of 36 countries surveyed.
Washington still has the alliances. Beijing has the momentum.
America still leads China by 6.8 points in the Asia Power Index. The less comfortable figure is China’s 20.1% share of ASEAN trade.
Deterrence becomes harder when the states being reassured cannot afford to upset the state being deterred. More via @britinfluence.
Japan is watching China’s carriers. Beijing is building leverage through trade.
China’s military spending has risen for 31 straight years. It now accounts for one dollar in every five of ASEAN’s trade.
The fleet is visible. The dependency is quieter.
A larger budget does not settle the strategic question. Can Washington stop the Gulf war consuming the munitions, ships and attention needed in the Pacific? More money may help. Sequence and delivery will decide whether it matters. Read more via @britinfluence.
America has ordered tomorrow’s deterrence. China is testing today’s.
US military spending fell 7.5% in real terms in 2025. The FY2027 request is $1.5tn. Meanwhile, PLA aircraft logged 3,764 incursions into Taiwan’s de facto ADIZ.
The problem is timing.
An ADIZ is not sovereign airspace, and an incursion is not an attack. Even so, 3,764 PLA aircraft entries in 2025 show how sustained pressure can alter the baseline. That is the contest now. Today’s Power Brief is on the League of Nations profile.
Deterrence is not a shopping list. Taiwan and its partners need forces that can disperse, communications that survive and repair crews that can work under fire. Britain’s fighter programme with Japan gives it a direct interest. More from @britinfluence.
Japan’s latest defence white paper is blunt: the balance across the Taiwan Strait is shifting quickly towards China. PLA aircraft entered Taiwan’s de facto ADIZ 3,764 times in 2025, up 22.4% on 2024. An ADIZ is not sovereign airspace, but the pattern is hard to dismiss.
If Britain exports renewable power using Chinese-controlled storage inputs, is that sovereignty—or merely a better-positioned dependency? Our latest Power Brief examines the trade-off. Visit the League of Nations profile.
Britain’s energy problem is not simply how much power it can generate. It is who controls the platform underneath. China makes over 80% of battery cells and dominates their key materials. Visit the League of Nations for the full Smart Power analysis.
5/5 Britain can become Europe’s power socket. But replacing Russian gas dependence with Chinese battery dependence is not Smart Power. Read today’s Power Brief from the League of Nations—visit our profile.