$NNE
NNE - daily chart analysis 💛
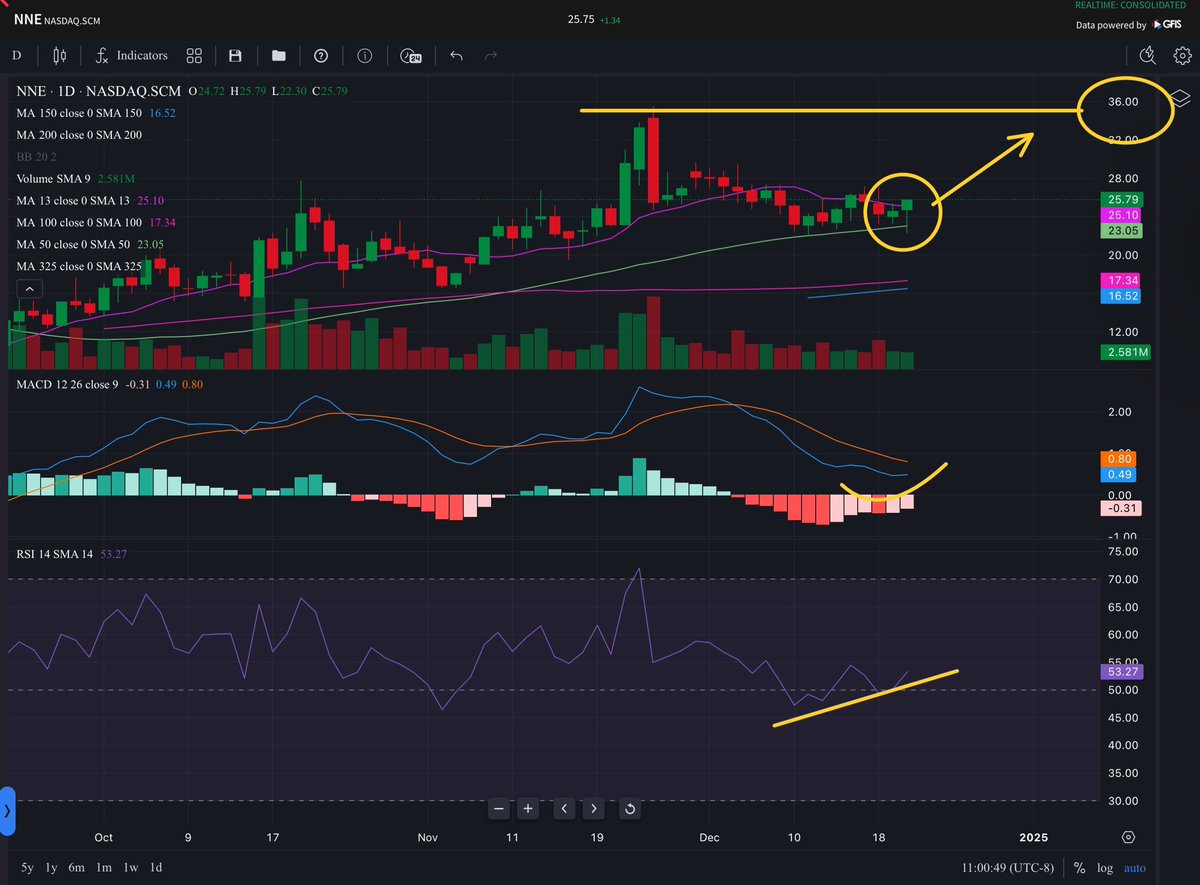
My target for this chart is 🎯$35 👀
We have a double bottom off a key moving average the 50DMA. A hammer candle is setting up and it looks like once the recent neckline is taken out then it’s off to the races for recent highs
MACD is beginning to curl and RSI has already developed an uptrend
Not financial advice!