Cetera Investment Management LLC, owned by @CeteraFinancial, provides market perspectives, portfolio guidance & other investment advice to its affiliated firms.
Consumer prices are up 28% this decade, but the pace remains below the 1970s and 1980s when inflation had already exceeded 40% at a similar point. By comparison, the consumer price index was up 104% over the full decade in the 1970s.
US layoff announcements climbed to 97K in May, marking the 2nd highest May reading since the GFC, surpassed only by May 2020. The increase was driven by the Tech sector, which accounted for 38K job cuts. Positively, hiring plans are higher YTD vs 2025.
Service activity advanced in May, with the ISM Services Index edging higher to 54.5, near its long-term average. While new orders expanded, price pressures continued to mount. The prices paid index reached its highest level since August 2022.
Private payrolls increased by 122K in May per ADP, slightly ahead of expectations (+117K). Hiring was the strongest in 16 months and relatively broad-based across firm sizes and industries. Education and health services (+57K) led overall job gains.
Job openings rose to a 7-month high of 7.62 million in April, well above expectations of 6.8 million. Openings exceeded job seekers, indicating rising labor demand. Overall, labor market data has stabilized in recent months following weaker trends in 2025.
The S&P 500 has notched all-time highs in each of the last 5 trading days and 23 times in 2026, after 96 record closes over the prior two years. Yet sentiment remains cautious, with bears outnumbering bulls in the latest AAII weekly survey.
On @FoxBusiness, our CIO @GeneGoldman joined @LizClaman on The Claman Countdown to discuss why we're in a "MOJO Market" – Markets On a Joyride of Optimism. Gene explained how strong earnings, a resilient economy and cash on the sidelines continue to support stocks, while rising inflation and geopolitical risks could lead to increased volatility. Watch the full segment here: https://t.co/Yk4WGiusDi
Markets are riding a nine-week rally, but a data-heavy week will test that momentum. With PMIs, job openings, and the May jobs report in focus, we are watching labor strength and inflation signals closely. The question: can the rally continue, or does volatility return? See what Chief Market Strategist @btklimke thinks in #TheWeekAhead https://t.co/biXDsys27U
The ISM Manufacturing PMI climbed to a 4-year high in May. While manufacturers continue to face rising price pressures and supply chain constraints, overall production activity and new orders are improving.
The S&P 500 has fully recovered from the Iran war correction, but market breadth is weaker than at the onset of the war. Only 2 of 11 sectors have a higher share of stocks above their 200-day MA vs 3 months ago. Tech and Real Estate are the exceptions.
The S&P 500 logged its 9th straight week of gains for the first time since 2023, with no streak lasting longer since 1985. While the sample size is limited and outcomes have been mixed, the S&P 500 was higher a year later in 3 of 4 instances.
The S&P 500 technology sector’s trailing 12-month P/E ratio has risen from around 14 a decade ago to over 41 today. Tech valuations are elevated, but they remain below the extremes of the 2000 tech bubble peak when the P/E ratio reached 77.
While broader inflation has recently been influenced by rising energy costs, there are emerging price pressures from durable goods, a category that has largely been deflationary in recent decades outside of the pandemic period.
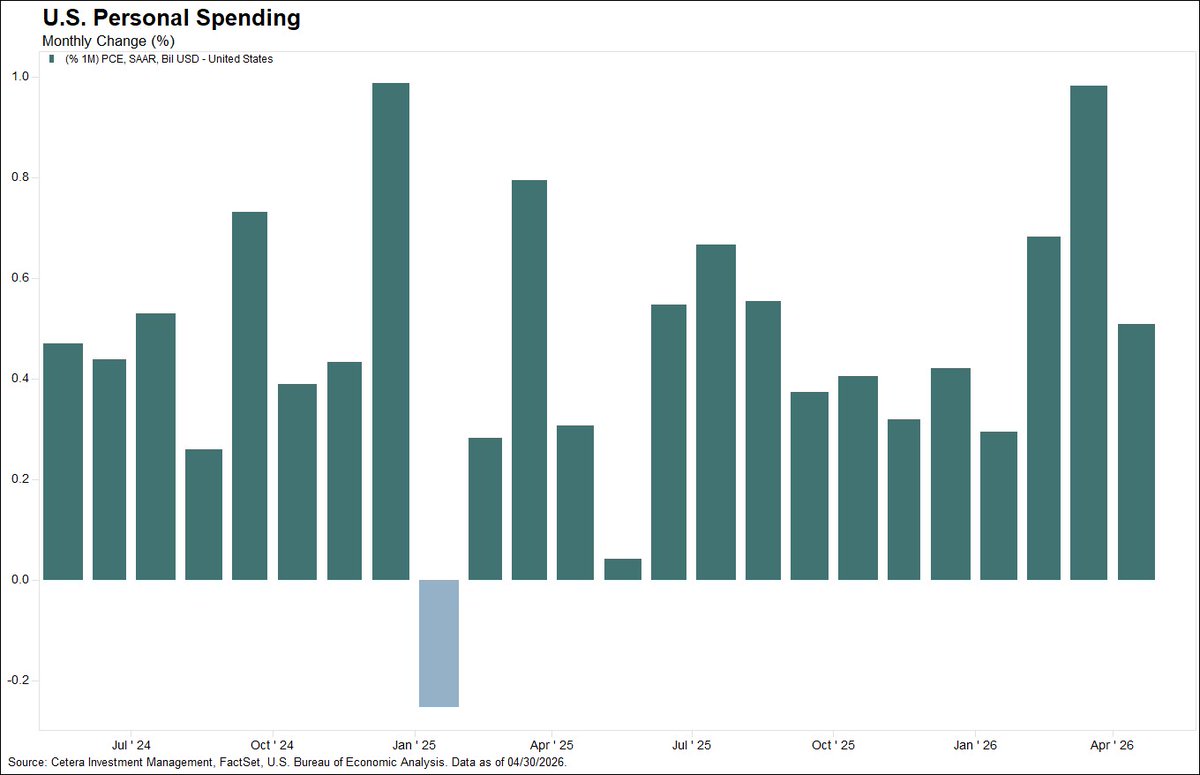
US personal spending grew 0.5% in April, matching expectations despite flat personal income growth. Services spending increased 0.4%, while goods spending rose 0.6% led by a 6.7% rise in gasoline consumption.
The late 1990s tech bubble not only featured higher stock valuations than today, but corporations were far less profitable. While today’s valuations are elevated, corporate profits are roughly 12% of GDP compared to 6% at the peak of the tech bubble.
Credit markets are pricing in a stable outlook and low default risk. The high yield spread of just 272 bps is well below the long-term avg of 516 bps. While spreads can widen rapidly during periods of stress, they remain compressed by historical standards.
Is frothiness returning to the stock market? 54.8% of consumers expect stocks to rise in the next 12 months, the second highest reading on record. This follows 8 straight weeks of S&P 500 gains, reinforcing how bullish sentiment rises with stock prices.
A quiet week for data, but Thursday’s PCE report still matters. Inflation is expected to remain above the Fed’s target. But the bigger driver? Geopolitics—especially in the Middle East. See why Chief Market Strategist @BrianKlimke says markets may take cues from headlines, not data, this week.
S&P 500 earnings grew 28.5% in Q1 (96% of firms reported), the highest since Q4 2021, and well above expectations of 12.9% at the start of the quarter. Technology (+53.3%) led all sectors, followed by Communication Services (+49.0%) and Materials (+42.5%).