Observable Plot 0.6.7 is here 🎉, and with it, our first foray into interactive visualization! I’m so proud of the subtle details that make it shine. What makes it so great? 🧵 https://t.co/EYsvz25ddZ
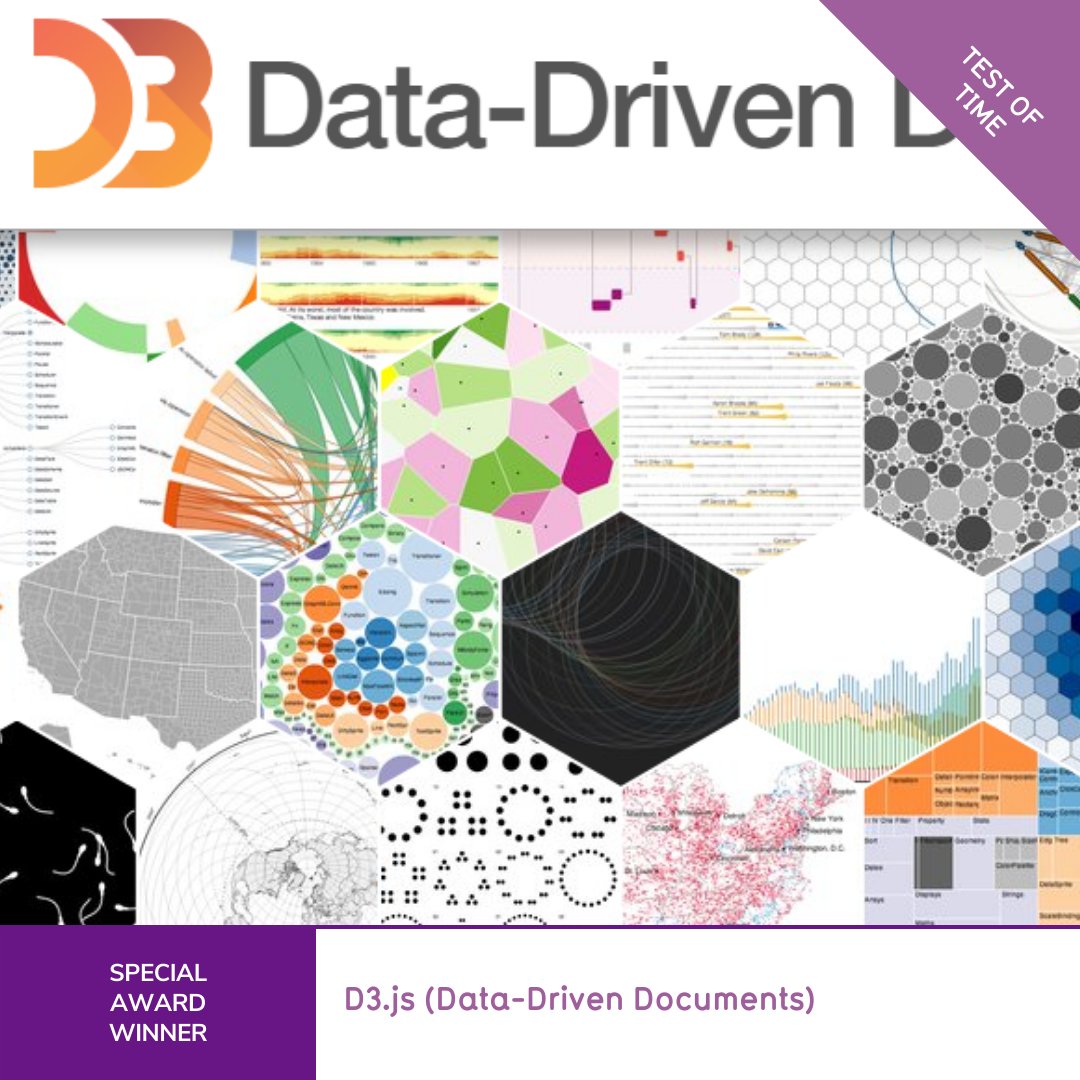
@d3js_org (credited to @mbostock, @jasondavies, @recifs) wins the Test of Time Special Award for the 2022 #IIBAwards. In the words of the judges, “since its humble beginnings in 2011, d3.js has become inextricable from the data viz world.”
#ieeevis InfoVis 10 year Test of Time award to D3, by @mbostock@jeffrey_heer & @VOgievetsky
What can I say. More citations than any InfoVis paper ever. More real-world impact than any InfoVis paper ever.
d3.js for the win!!!
A new generation of D3 examples, structured as functions of data + options for convenient use and reuse, anywhere. Announcing: D3 Charts! 🎉 https://t.co/hwisGhQcY8
for work i wrote up ~ten things to know about Plot for someone (me) who only knows d3. through my ignorance of ggplot & Vega-Lite, i experienced the “grammar of graphics” paradigm fresh in Plot, & feel a debt of gratitude and an itch to read the classics https://t.co/ikI4at7DA8
We're excited to announce Observable Plot, a new open-source library for faster and easier data exploration on the web! 📈🚀
Plot's concise API and thoughtful defaults are designed for a more joyful visualization process, try out the beta and let us know!
https://t.co/855uQuyTAi
Do you have lots of time series (analytics, say) you’d like to visualize? Try horizon charts! They’re space-efficient, and when aligned by time you can see coincident patterns across series. A little library: https://t.co/pzZLw7u4DH
It’s been ten years since I pushed the first release of D3.js to GitHub. Have I learned anything? I hope so… but it’s a journey. https://t.co/MM4K870IiJ
The #d3js 10 Year Celebration Kick-off event is tomorrow with announcements for the D3 community and reflections on lessons learned from 10 years of #opensource data visualization 🎉
👉 https://t.co/yWHvhTZQB4
hosted by @enjalot. Speakers include @mbostock@mmeckf@sxywu & More
Join us on Feb 17th to celebrate 10 years of #d3js!
We have some exciting announcements for the D3 community and reflections on lessons learned from 10 years of #opensource data visualization 🎉
https://t.co/YGNL9gfIvj
Observable Inputs is more than basic inputs (sliders, checkboxes, etc.) — it includes fancy inputs for exploring tabular data and is designed to work together with tools such as D3 and Vega-Lite. A quick tour: https://t.co/NsJnnMjxdf
After many months of being intrigued yet afraid of both d3-force and Observable notebooks, I have finally decided to dive in and ended up making a little tutorial.
https://t.co/zwliBjM2V2
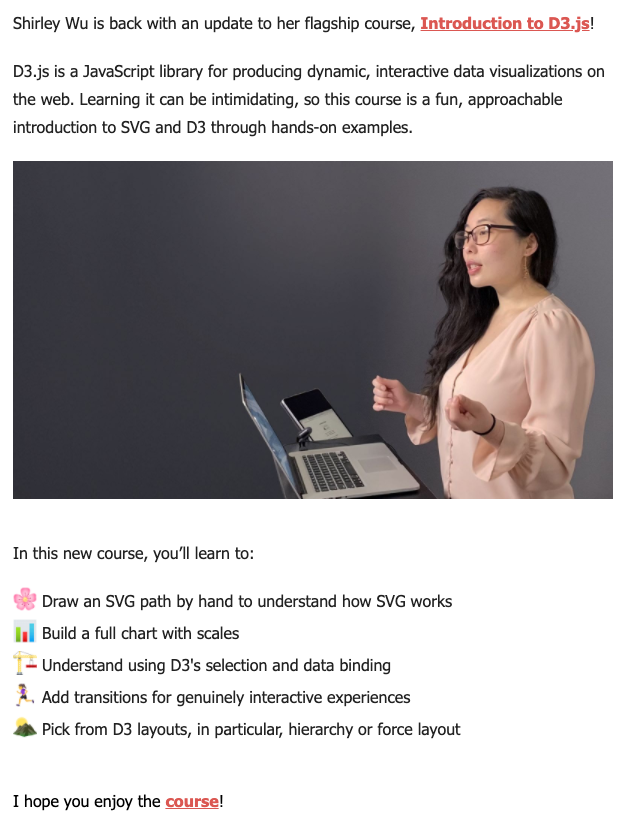
🎊My updated Intro #svg+#d3js course is out @FrontendMasters🥳
Please check it out—I put so much 💖💭⏰ into it & am esp proud of all the small exercises that build up to one big #dataviz by the end🌸✨
🔗https://t.co/kynvs3zeLR
📚https://t.co/jXoPBZqfN2 made w/ @observablehq