The Genie is out of the bottle! ✨
Meet Genie, Databox’s AI analyst.
Ask your data a question. Get an answer, instantly.
Use it to:
- Analyze performance.
- Build dashboards.
- Create metrics.
All from a simple prompt.
Comment "Genie" and we’ll DM you a free month of our Pro plan + our AI Analyst Prompt Playbook.
Revenue +6%. Leads +22%. Pipeline -11%.
The free Executive Decision Brief skill turns that into a one-page leadership brief: wins, risks, contradictions and 3 decisions. Runs in Databox or Claude.
https://t.co/mkx5GsZ0O5
Google Ads and Meta both said about $210 per conversion. Looked like a tie.
Checked against HubSpot through Databox MCP in Claude: Meta's 41 conversions became 1 SQL. Google's 58 became 11.
Not a tie.
https://t.co/egldcYm12B
MRR down 3.9%. Churn or failed payments?
We asked the Databox AI Analyst. Through the Stripe MCP connector: 2 cancellations and 3 failed payments. $2.9k still recoverable.
https://t.co/3Uq8iHRbIF
Best MCP servers for marketing and sales teams, one per job:
HubSpot, Slack, Meta Ads, Semrush, Klaviyo, Webflow, Stripe, Notion.
Then connect them to one AI analyst that also knows your numbers.
https://t.co/tENknBM7s2
Why did our pipeline drop 17.5%?
One question to the Databox AI Analyst. It read the deals behind the metric in HubSpot through the HubSpot MCP connector: 3 lost deals, 2 lost on price.
https://t.co/ol7lX8dFjj
Databox, from your terminal. And your agent’s.
Databox CLI is live on @ProductHunt today.
- Pipe any JSON into Databox
- Turn rows into metrics
- 10 agent skills for Claude Code, Cursor and Codex
- Nightly runs with safe retries
Open source. On every Databox plan.
Leaky funnel?
You need more than a gut feeling to fix it.
Computan built a skill that connects to your HubSpot or Salesforce pipeline through Databox MCP and diagnoses where deals are leaking, blocked, or going stale. It uses your own funnel's history, not universal benchmarks nobody's business actually matches.
What you is a 3-level diagnosis:
💧 leakage (deals dropping out),
🚧 blockage (deals accumulating or slowing in a stage), and
⚠️ early warnings (leading indicators of future revenue trouble).
The output is a ready-to-share report, written like a RevOps analyst briefing a CRO, using a prioritized point of view, not a metric dump.
Works with HubSpot CRM and Salesforce and is free to download and set up 👉 https://t.co/VD8xhMsFZO
We launched MCP Connectors on Product Hunt today 🎉
The goal: close the gap between seeing a number and knowing why it changed.
As of today, our AI Analyst connects to the tools where your team's context actually lives (like your CRM, Slack, support desk, Linear, and more), and pulls that context in to explain why your numbers changed.
✔️ 10+ one-click connectors are live today, including HubSpot, Slack, Notion, Linear, and Mixpanel, plus support for any custom MCP server.
It's not read-only either. With permissions you control, Databox can act on what it finds: pausing an underperforming ad campaign, updating a stalled deal, or creating a task for sales.
⭐️ Check out more in our Product Hunt campaign: https://t.co/voKVHC3Wlp
We just added a brand new skill to our Skills Marketplace library, built by the team at Computan.
If you want an expert-level brief based on your real-time data, the Executive Decision Brief does the interpretation a good analyst would do, and produces a one-page HTML briefing a CEO can skim in 90 seconds.
✔️ It identifies the significant moves ranked by business importance (not raw percentage change), connects related metrics, and specifically hunts for contradictions between signals because those are what leadership most needs to discuss.
✔️ It's perfect for CEOs and founders who need a clear story before a leadership meeting, agency owners running QBRs across multiple clients, and any senior leader who's tired of walking into reviews without a coherent brief.
To use it, simply connect your Databox sources, download the skill, install it in Claude, and trigger it on demand. Free to download, 5 minutes to set up. 👉 https://t.co/008uPCKadR
Do you use artifacts in your reporting?
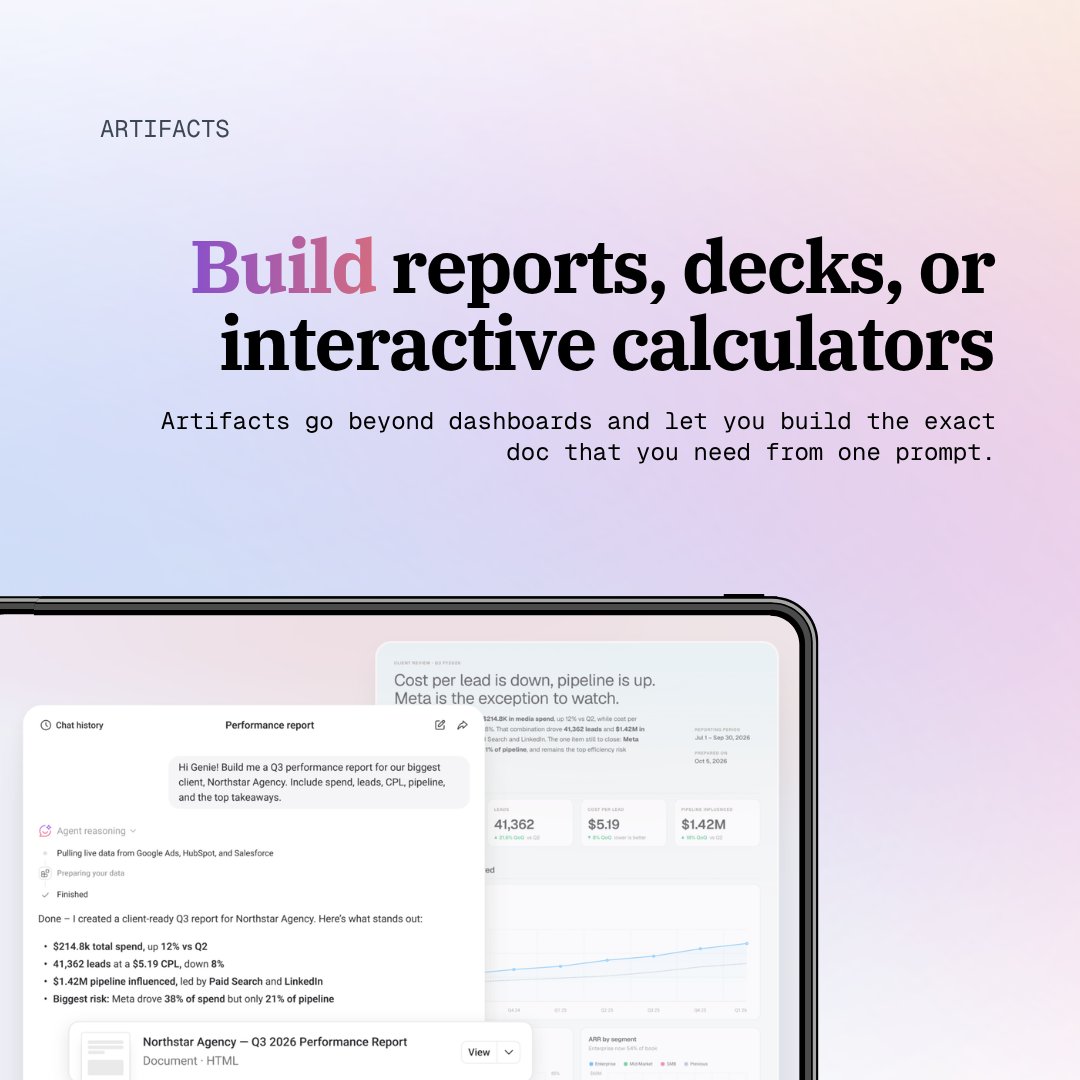
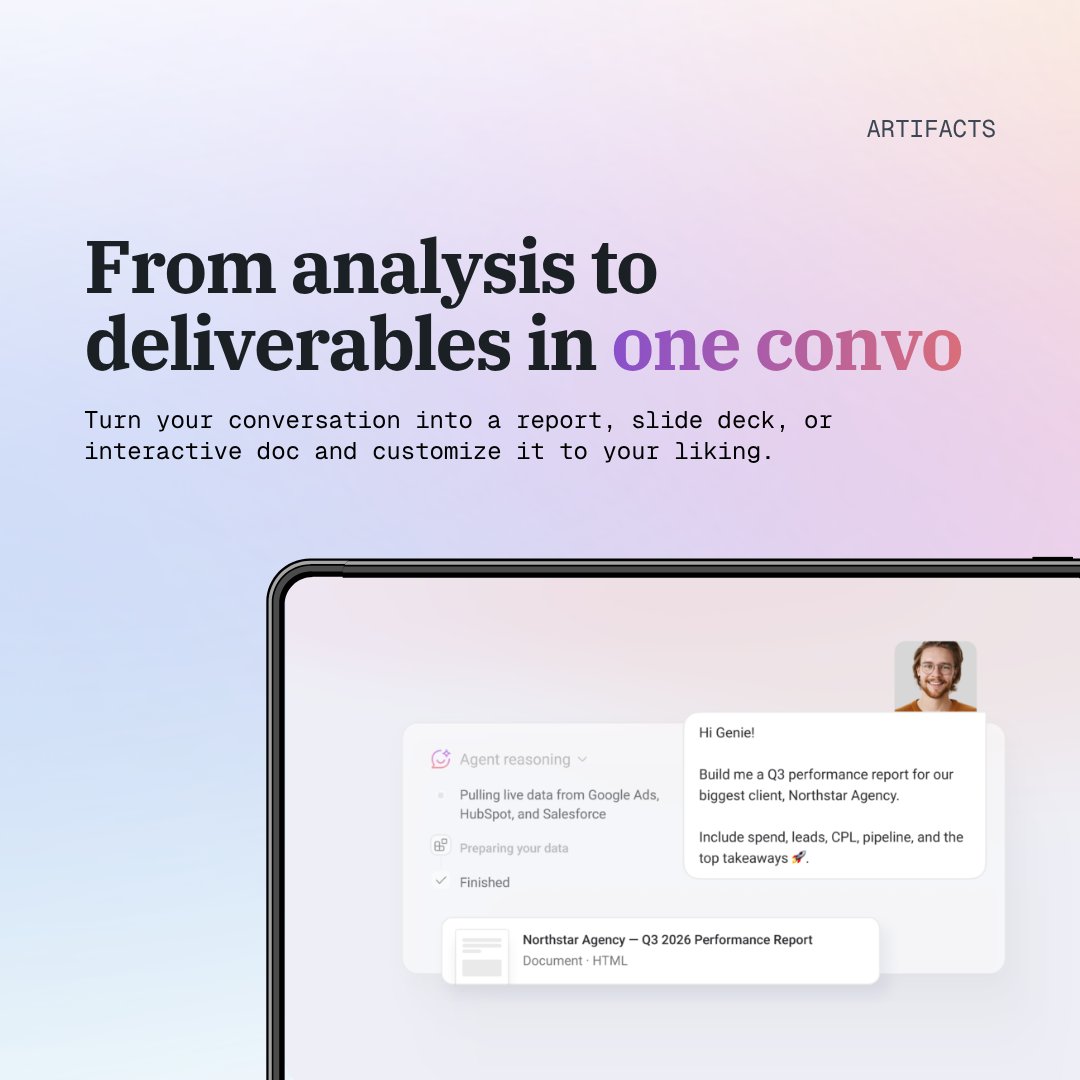
Turning an answer into something shareable takes seconds. Just say "turn this into a report," and Databox's AI Analyst will return a real, polished document, ready to share.
Here's how artifacts work:
✅ Turn any conversation into an artifacts and create a report, slide deck, or interactive doc without redoing analysis
✅ Keep it on-brand by adjusting headlines, fonts, colors, layouts, and styles
✅ Share it with anyone using a public link or ODF doc, no login required
✅ Everything you create is saved and searchable, so you can reuse it anytime
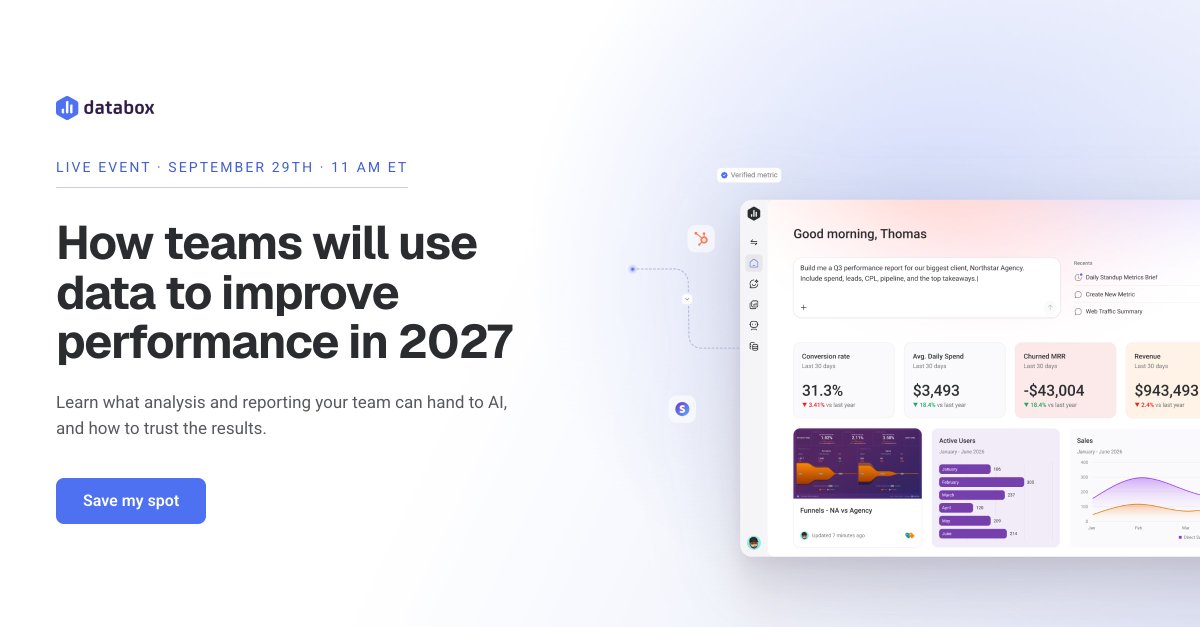
Being able to build artifacts from simple prompts is just one small piece of what we are calling agentic analytics. If you want to see what your reporting stack should look like in 2027, join us on September 29 at our live event 'How Teams Will Use AI for Reporting in 2027'
Save your spot: https://t.co/plCLtsnDff
🚨 New skill alert: Executive Decision Brief built by our partners at Computan
It reads all your data sources you've connected to Databox and turns it into a one-page executive briefing: the headline story, key movements, wins, risks, and three "should we" decisions.
Want a report a CEO can skim in 90 seconds?
Download the skill for free here:
👉 https://t.co/HHxp7Zv6rg
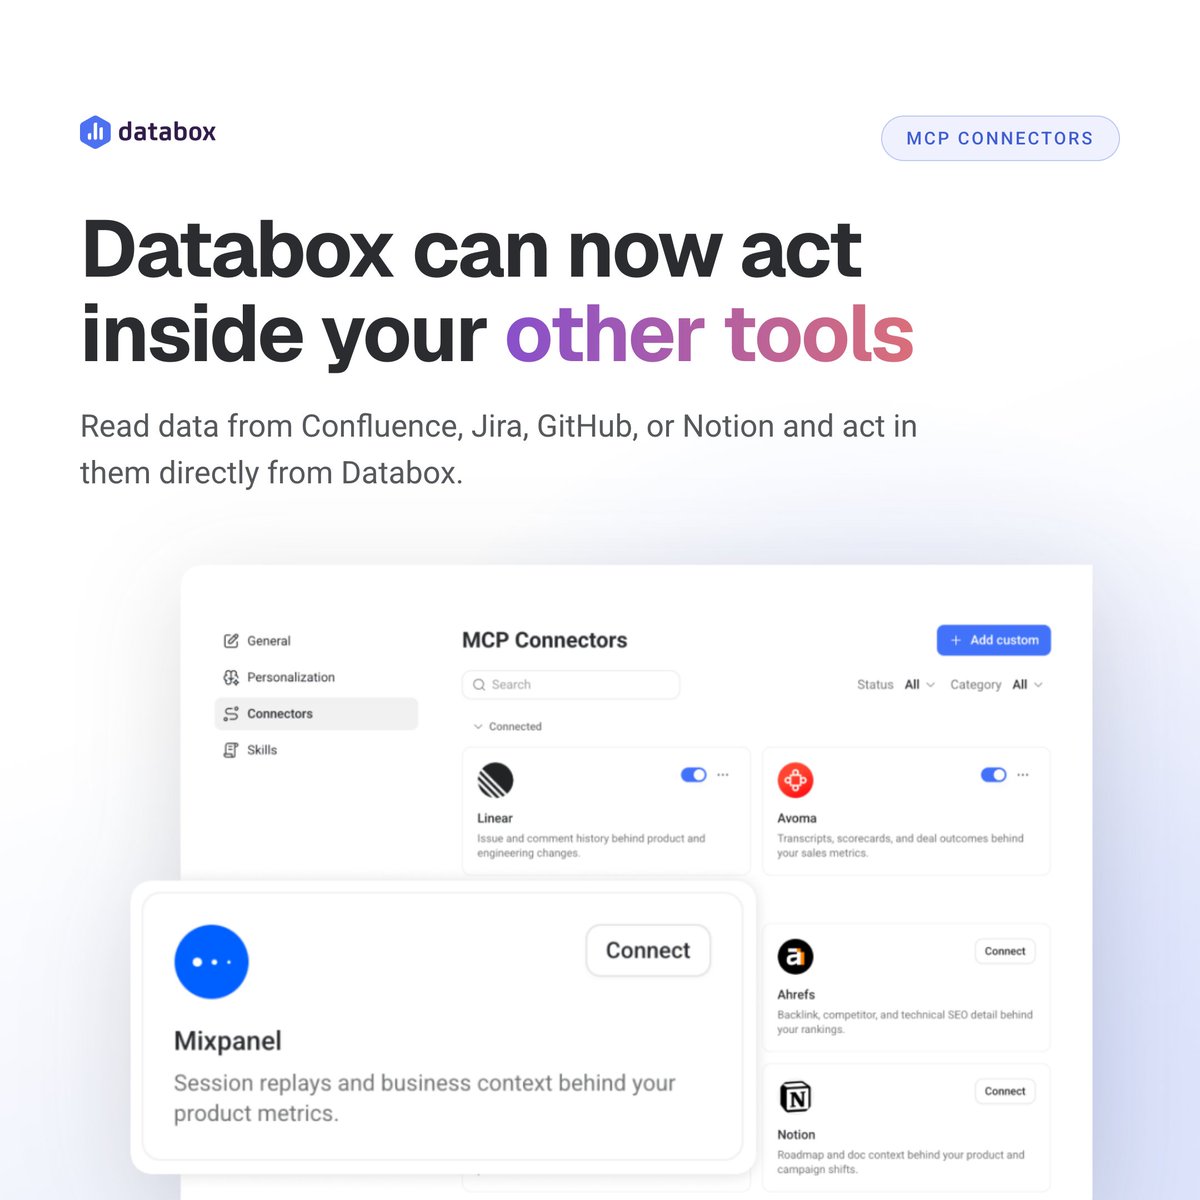
📣 MCP Connectors are live inside Databox.
Here's why this is a big deal:
Databox can now read your other tools, like Confluence docs, Jira tickets, GitHub releases, call transcripts.
🤔 What does this mean in practice?
You ask why signups dropped and it doesn't just check your data, it checks what actually shipped this week.
Databox can act in those tools, too, like file a ticket, update a board, or write a doc. All from a chat with your AI Analyst.
Today, 13 MCP connectors are live, plus a custom option for anything else you run on.
Try it free, today.
Or join our 🔴 LIVE walkthrough on September 29 and learn what the new baseline for agentic analysis is: https://t.co/40bXO84IIu
📅 Is your analytics stack actually ready for 2027, or just dressed up for it?
That's the question we're putting on stage on September 29.
Most teams already have dashboards in place.
Fewer can answer whether their stack has:
✅ data that's actually connected,
✅ metrics everyone agrees on, and
✅ an AI layer that works from real context instead of whatever you type into a prompt box that day.
That gap is what "agentic analytics" is actually about, and it's the line between teams that are ready for what's coming and the ones re-explaining the same numbers every quarter.
This is not a product demo. We're walking through what it means to be ready: end-to-end, question-to-action, live.
Join us on September 29 🔴 LIVE to find out where your stack actually stands.
💥 Register here: https://t.co/oH8N8GjfrH
Here is how to leverage agents to learn which paid channels are driving quality traffic for your business.
✅ We just launched a free n8n workflow that does that for you.
The workflow runs 3 AI agents in sequence every morning at 8am.
🤖 Agent 1 pulls website analytics from Databox (sessions, bounce rate, pages per session, session duration, goal completions, etc.)
🤖 Agent 2 pulls paid performance across all connected ad platforms (spend, clicks, CPC, CTR, impressions, ROAS, etc.)
🤖 Agent 3 receives both outputs, runs cross-channel correlation and produces what neither dataset can show alone: a platform efficiency ranking and exactly 3 specific budget recommendations grounded in that day's data.
The result is a styled HTML email delivered before your day starts. No manual input, no logins, no copy-paste.
If you haven't leveraged agents for your analysis and reporting yet, this is a great way to try it out.
You can test out the workflow for free 👉 https://t.co/dLrB8H2hRW