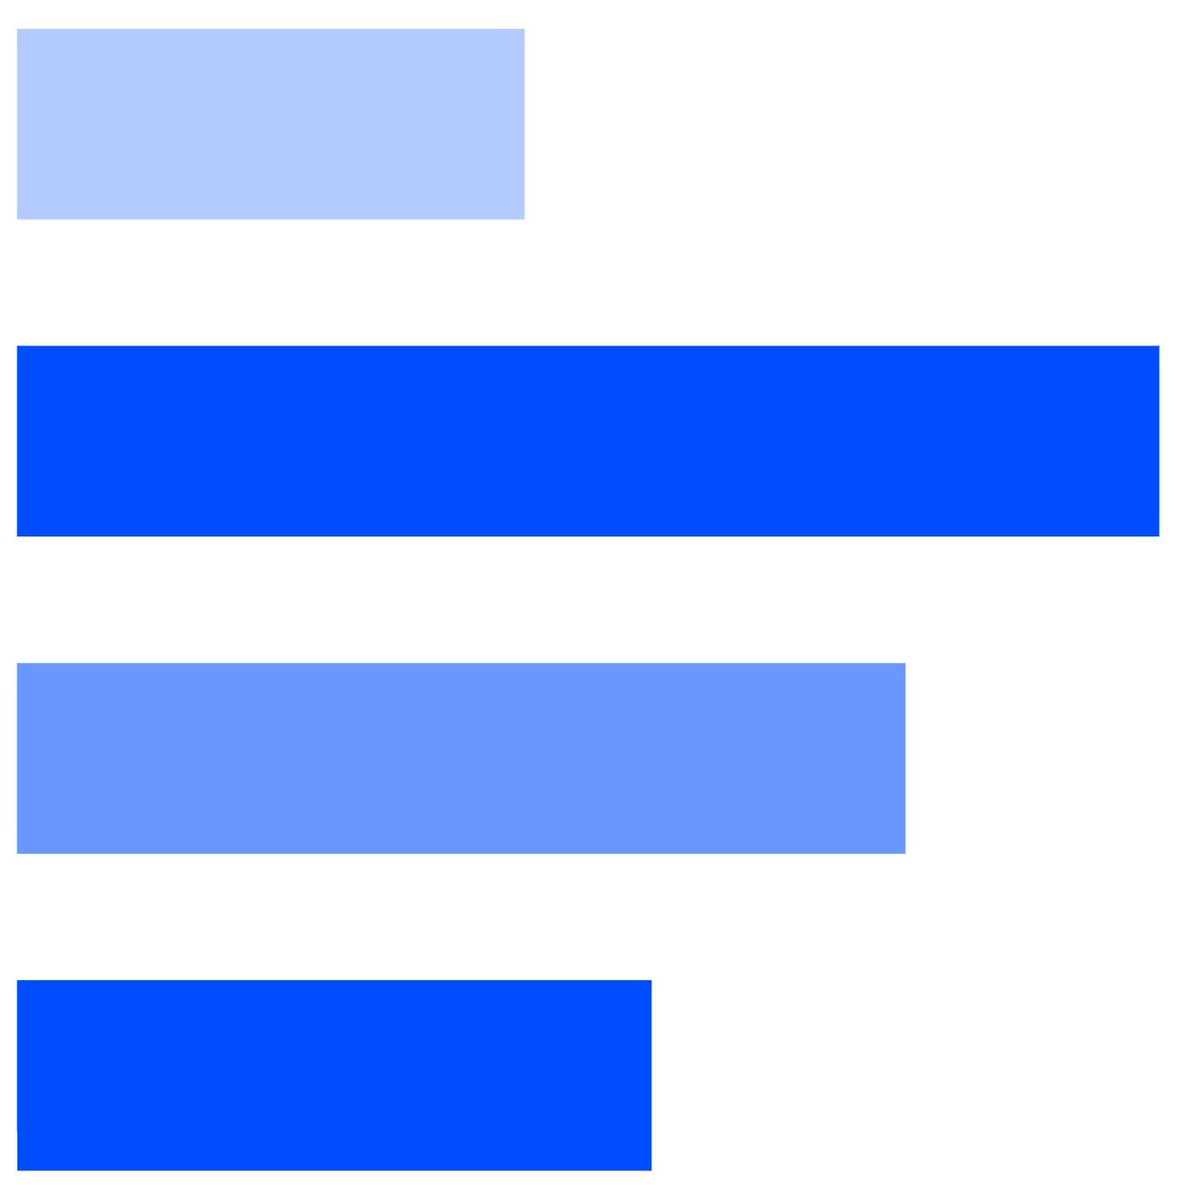
To make charts color blind friendly, use colors for groups, not individual categories. This reduces the number of colors, visual clutter, and color confusion.
More color blind charts tips: https://t.co/Q2GfQtaz1A
To ensure charts are color blind friendly, use a single hue palette for all types of color blindness, including monochromacy. Alternatively, a red-yellow-blue palette works for all except monochromacy.
More info on color blind charts: https://t.co/Q2GfQtaz1A
To make charts accessible for color-blind users, consider using color-blind friendly palettes and adding strokes around elements to enhance distinction.
More about charts for color blind: https://t.co/Q2GfQtaz1A
To make charts color blind friendly, use alternatives like dashed lines and varying stroke thicknesses for line charts and their variations.
More about charts for color blind: https://t.co/272IYADLsH
To make charts color blind friendly, it's better to use direct labels instead of a legend, as this saves the reader's time and attention. Direct labels also help correct palettes that aren't color blind friendly.
Read more: https://t.co/Q2GfQtaz1A
To make charts color blind friendly, use shapes and icons as alternatives or additions to color-coding. If colors are not visible to colorblind users, use icons to convey information alongside colors.
More about charts for color blind: https://t.co/272IYADLsH
To make charts accessible for those with color vision deficiencies, use a color scheme with red and blue, avoiding red-green combinations. Adjust the saturation or brightness of these colors and add orange and yellow for variety.
Read more: https://t.co/Q2GfQtaz1A
Pie charts should always total 100% for accuracy, especially in part-of-whole scenarios. Rounding can cause errors, but these can be fixed. If data doesn’t naturally sum to 100%, consider using a bar chart. More tips: https://t.co/sZPyIVo0XV
Pie charts use sectors to represent values, which can be hard to interpret. They're most effective with fewer than five sectors and distinct differences. Group smaller values into an "other" category for clarity. More chart fixes: https://t.co/sZPyIVo0XV
The function of a line chart is to visualize continuous data, so using a line chart for discrete data is both strange and wrong. An alternative would be any chart that can work with discrete data, for example a bar chart.
More bad chart fixes: https://t.co/sZPyIVo0XV
Choosing the right scale for a line chart requires balancing value context and change clarity. A large scale might flatten the line, while a detailed scale may lack context. Consider using one chart for context and another zoomed-in for detail.
More tips: https://t.co/sZPyIVo0XV
Cumulative charts aren't inherently bad but are often overused because they show an upward trend, misleading readers. A line chart showing period changes is a better practice.
More tips: https://t.co/h35kyE5YxB
A spaghetti chart can be confusing due to many overlapping lines. To improve clarity, create separate charts for each line or small groups of up to four. If all lines must remain in one chart, use gray for all lines and highlight the focus line. More tips: https://t.co/sZPyIVo0XV
Column charts struggle with fitting wide labels, leading to overlap, while tilting labels is inconvenient. Bar charts are a better alternative, as horizontal bars accommodate labels more effectively.
More bad chart fixes: https://t.co/sZPyIVo0XV
Grouped bar charts can be confusing with many items and series, especially if a legend is needed. Use fewer series (under three) for clarity, or try line charts or dot plots for a cleaner look.
More bad chart fixes: https://t.co/sZPyIVo0XV
Icons, essential in data visualization, can distort interpretation when used iso bars in bar charts by affecting height and area perception. Complex shapes further confuse area understanding. A regular bar chart is preferable.
More bad chart fixes: https://t.co/sZPyIVo0XV
Truncating the Y-axis in bar charts can distort data perception. Use icon charts, which represent values through area, or treemaps for a more accurate and compact display.
More on fixing bad charts: https://t.co/3Wi22aVsUI
Data visualization involves using visual elements to present data, but numbers and labels are essential for context and meaningful charts.
More on correcting bad charts: https://t.co/3Wi22aVsUI
Handling large datasets is difficult. Scatter plots use lots of elements to represent variables, but overuse can lead to confusion. Focus on key messages and variables. Use grey for general data and color for key points.
More tips on improving charts: https://t.co/3Wi22aVsUI
Charts should not be placed side by side if it might imply they share the same scale or axis. Place charts on top of each other if they share the horizontal axis, and side by side if they have the same vertical axis.
More on fixing bad charts: https://t.co/h35kyE5YxB