🚨 Bullish sentiment hits a 29-year extreme.
Previous spikes at similar levels have preceded stock market corrections.
We're tracking the critical price levels that matter most right now.
See 18 charts sending warning signals: https://t.co/2VWYMuL6RC
🚨 Nasdaq drops more than 2%
Before the decline, our Intraday Stocks Pro Service warned subscribers to watch for signs of an exhausted rally and a downside reversal.
When markets turn, every point matters.
Get expert guidance through the twists and turns of the Nasdaq, S&P 500 and Dow: https://t.co/RKMgRszrHi
Pay attention to who's buying gold - and who's selling it.
Large speculators just made a major jump in bullish positioning, an unusual move for a group that typically follows the trend.
Meanwhile, commercial traders - the people closest to the physical gold market - have built one of their largest net-short positions in 16 years.
That's a signal worth watching.
See where Elliott waves point gold next: https://t.co/h9IcAZ9km7
How do you find trading opportunities among 8,000+ global markets?
You don't manually scan charts all day.
Our Flash Services use EWAVES® software to screen thousands of stocks, ETFs, futures, bonds, crypto assets and more for Elliott wave setups with favorable risk/reward potential.
The result? A shortlist of opportunities worth watching — and alerts when conditions line up.
Read the interview: https://t.co/tjQ736JzvB
Interest on the federal debt is about to become America's largest government expense.
At the same time, President Trump has proposed increasing defense spending from $917 billion to $1.5 trillion.
Two of Washington's biggest costs are rising together.
What could go wrong?
What Elliott wave pattern do you see?
Take a look at this weekly chart of $ALGN and post your wave count.
As Trader's Classroom instructor Robert Kelley notes:
"When you have clear patterns of a larger degree, there's not a lot of reason to focus on the internals of earlier price action. We're most interested in the forecast."
Can you identify the pattern - and more importantly, what it suggests could come next?
Share your count in the comments.
Learn more with Trader's Classroom: https://t.co/TSPQ9ckEPO
Stress is building in the private sector.
Swiss-based private equity giant Partners Group has reportedly capped withdrawals from its flagship fund after redemption requests surged beyond the fund's limits.
More than a year ago, we warned that liquidity stress in private markets could lead to gates closing across the sector. Since then, several funds have restricted investor withdrawals.
The question now isn't what happened. It's whether this trend is just getting started.
Get fresh forecasts and market insights: https://t.co/LXvu1uaDSn
"C waves are where mindsets shift to terror of bankruptcy, fears of a sovereign debt crisis and ultimately apathy - giving up."
Check @MurrayGunnEWI's latest outlook in the June Global Market Perspective. https://t.co/CwK4PIVUXf
Did the semiconductors just top?
$SOX gapped higher at Wednesday's open and then gapped lower at yesterday's open - creating a Bearish Island Reversal Top.
It's now down ~13% in just three days.
Get ahead of major moves with expert guidance. https://t.co/61NVMjcixh
Nasdaq drops 1,000+ points.
Just before the selloff (June 3), Short Term Update editor Steven Hochberg warned:
"It’s still all about technology... The Nasdaq rally looks like a completed impulse wave."
He noted a key divergence as the Nasdaq 100 made a new high that wasn't confirmed by the broader market - a classic sign of weakening participation.
Complacency can be costly.
See what's next for stocks, bonds, gold, silver, forex and the economy in the newly published June Financial Forecast: https://t.co/UECUtZpNLC
$BTC decline continues!
Our Crypto Pro Service alerted subscribers to a completed triangle that would draw Bitcoin lower,
“Preferably, the wave iv triangle is complete at 64163.93, and a thrust lower in wave v is underway.”
🚨 $BTC drops $6,000+
Our Crypto Pro Service spotted a completed wave pattern ahead of the move and alerted subscribers, "Focus remains on a five-wave decline."
Don't be surprised by the next big move in cryptos: https://t.co/Km3UtZEyp7
OPEC cuts production.
Shipping routes are disrupted.
Offshore rigs shut down.
Bullish for oil, right?
Not always.
After Hurricane Katrina knocked out 95% of Gulf oil production in 2005, crude oil fell more than 20% over the next three months.
Markets don’t simply react to news - they often reveal something deeper about investor psychology.
Learn what really drives oil prices. https://t.co/CH9YvyLSlN
On September 16, 2020, Fed Chairman Jerome Powell told reporters at a press conference that he expected short term interest rates to stay near zero through “the end of 2023.”
The Elliott Wave Theorist shared this chart and said: "There’s not a chance in the world of that scenario playing out. [T]he probability is high that interest rates have begun a process of rising ..."
Result: Long term interest rates started rising across the board. T-bill rates stayed at zero through 2021 and then soared past 5% in just 18 months.
Imagine if you had read our advance warning of a once-in-a-generation opportunity to refinance your mortgage, get a long-term business loan, or pay off a credit card.
Start reading our unique and timely forecasts now: https://t.co/TCTGFyrba0
One of the biggest advantages of trading with the Elliott Wave Principle?
High-probability price targets.
Using Fibonacci relationships, traders can identify key levels and set targets.
Learn the basics free: https://t.co/8N9iOsSPHS
This chart from The Socionomic Theory of Finance shows global oil production and consumption from 1980 to 2014. The letters mark major turning points in the price of oil. Can you guess which way - and how far - prices moved at each point?
The actual price moves are listed in the second image.
See what really drives oil prices. https://t.co/CwfAI3ToFR
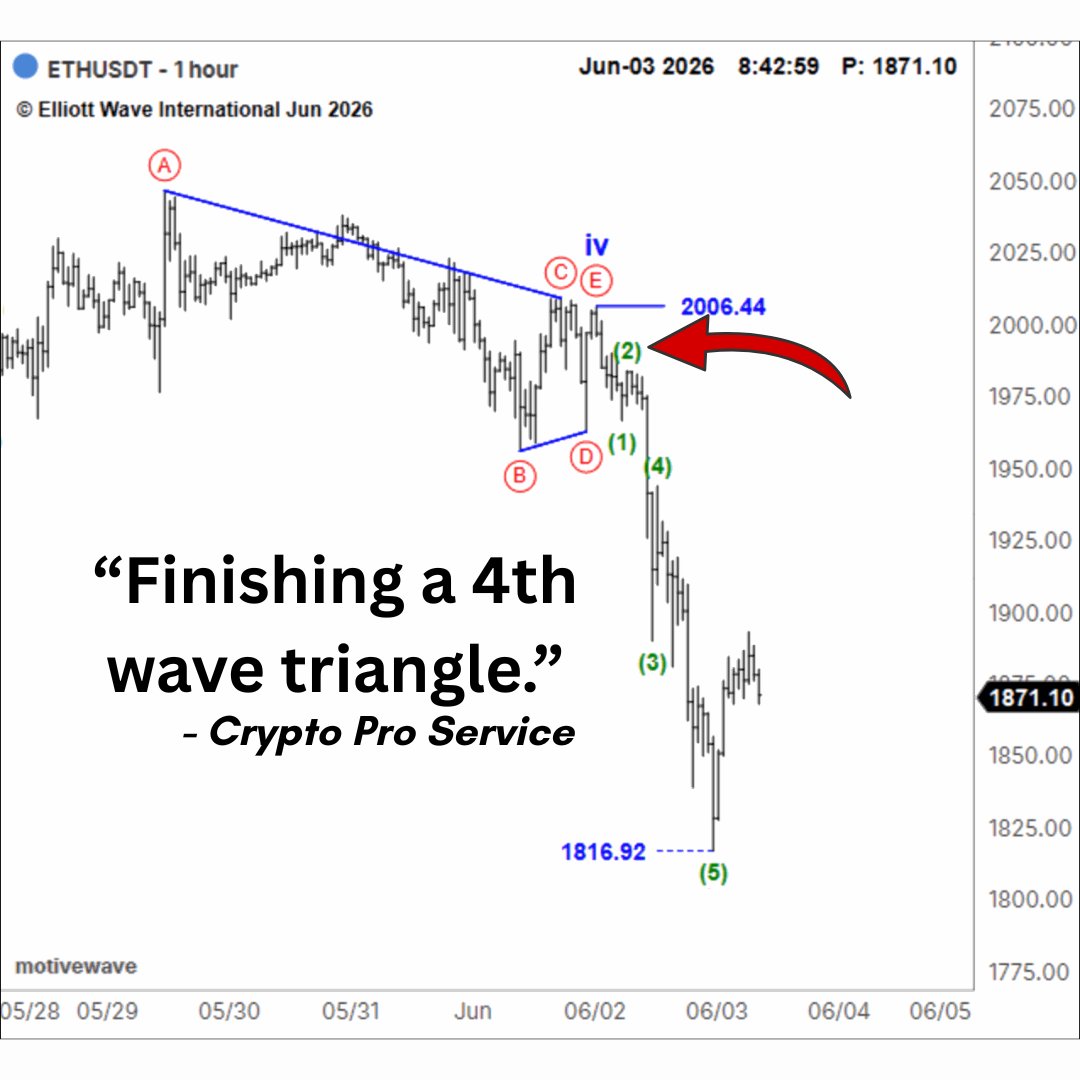
$ETH falls 9%.
Crypto Pro Service caught a setup in the charts - an Elliott wave triangle pattern.
June 2, 4:04 AM - "Bottom Line: Finishing a fourth-wave triangle. A five-wave breakdown below 1956.04 will favor the post-triangle thrust in wave v is underway."
In volatile markets like cryptos, minutes matter. Let us guide you to the best setups. https://t.co/v4HOJduH84
Did you label a zigzag?
Here's the answer to the Elliott wave challenge.
Checkout Waveopedia for helpful tips on learning Elliott waves. https://t.co/d5vN573Jru
The 10-year Treasury yield just completed a textbook five-wave move.
Elliotticians know what comes next, but what about the big-picture implications?
Follow the waves for more market insights. https://t.co/ylnoFE5LZq


![elliottwaveintl's tweet photo. On September 16, 2020, Fed Chairman Jerome Powell told reporters at a press conference that he expected short term interest rates to stay near zero through “the end of 2023.”
The Elliott Wave Theorist shared this chart and said: "There’s not a chance in the world of that scenario playing out. [T]he probability is high that interest rates have begun a process of rising ..."
Result: Long term interest rates started rising across the board. T-bill rates stayed at zero through 2021 and then soared past 5% in just 18 months.
Imagine if you had read our advance warning of a once-in-a-generation opportunity to refinance your mortgage, get a long-term business loan, or pay off a credit card.
Start reading our unique and timely forecasts now: https://t.co/TCTGFyrba0](https://pbs.twimg.com/media/HJ-6609WQAAbZxe.png)