The Archive currently holds thousands of artefacts: protest graphics, oral testimonies, performances, ritual gestures, songs, poems, letters from political prisoners, acts of everyday refusal. More than 300 artists, activists, translators, and witnesses have contributed directly.
In the past months I worked on a project I care so much about: The Woman, Life, Freedom Archive, by the Hamdel Futurist Collaborative. It follows acts of nonviolent civil disobedience, gestures that travel across Iran and through transnational networks https://t.co/ZR9iLEiLcJ
The archive centers on the 2022 uprising that began following the killing of Jina (Mahsa) Amini in the custody of Iran’s morality police, protests that erupted first in Saqqez, her hometown in Kurdistan Province, and spread rapidly nationwide.
Moving Lines tells the stories of M., M., M., B., S., O., I., A., R., F., M., M. and R., who crossed countries and borders to reach Europe. The project aims to give shape to these stories and these journeys, walking step by step alongside those who have travelled them.
I am genuinely moved to share this new project today, designed with Silvia Costantini and Alex Piacentini: Moving Lines – a visual narrative of asylum seekers’ routes: https://t.co/NUyLvlrQSn.
#dataviz#ddj#migration
In 2016 I started working on The Stories Behind a Line, a visual narrative of six asylum seekers’ routes. In 2021 I was contacted by Silvia Costantini, journalist who proposed using it as a starting point for a new project that – with the same approach – would tell other stories.
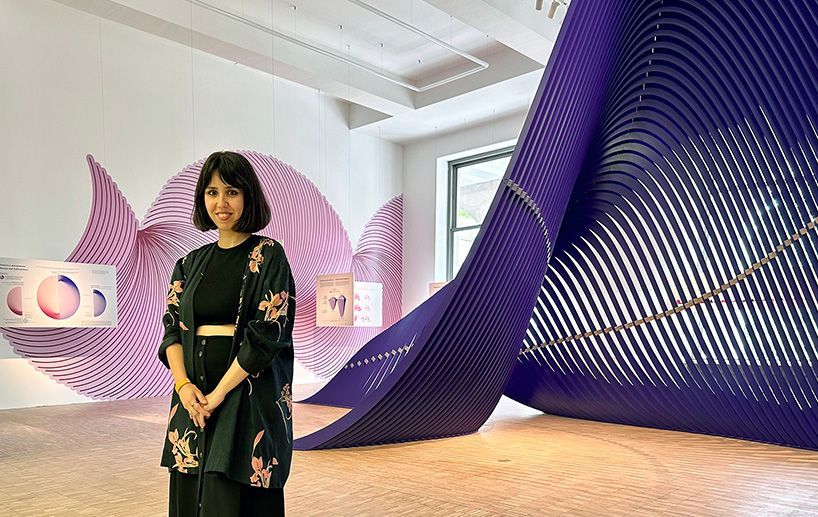
I designed +10 data visualizations to depict different shapes of inequalities, from economic disparities to global warming, from social mobility and discriminations related to ethnicity and gender.
The exhibition design is by Midori Hasuike, editing by Veronica Vannini
Delighted to welcome Dr Federica Fragapane (@fedfragapane), Dr Marta Foresti (@martaforesti) and Dr Francesca Panero (@TheFrappies) to talk on data visualisation. This talk explores how different visual words have been used to visualise information and stories. #LSEEvents
Tonight is the night!! Don't miss out on our wonderful event on Data Visualisation with Information Designer Federica Fragapane @fedfragapane plus discussants @TheFrappies and @martaforesti! You can join in person or online!
Find out more - https://t.co/ZmCstzKFNX
#LSEEvents
Independent information designer Federica Fragapane showcases examples of visual alphabets used to shape data related to themes such as economic inequalities, migration, and access to fundamental rights.
@fedfragapane#ForumInequalities
Curated by Elisa Medde, the exhibition was dedicated to photographer Luca Locatelli’s exploration of circular economy solutions. I designed five printed data visualization pieces and an interactive screen developed by Paolo Corti. https://t.co/6HFxG1M2EY
They get support from women's rights and education activists outside the country, who send monthly funding for textbooks and teachers' wages."
Sources: BBC, CNN, CBS News
More than 1000 days have passed since the Taliban banned teenage girls from school.
I am periodically updating the number of days, counting it, and visualizing it.
#letafghangirlslearn
Despite this, immensely brave girls in Afghanistan are refusing to accept the ban and are attending unofficial secret schools.
“Many of the unofficial underground schools in Afghanistan operate with limited resources — of both supplies and educators.