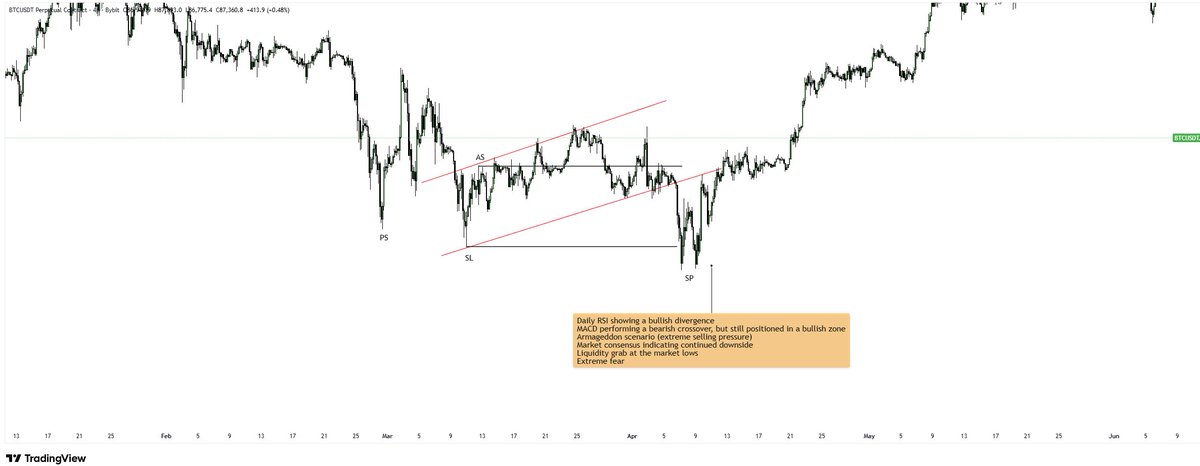
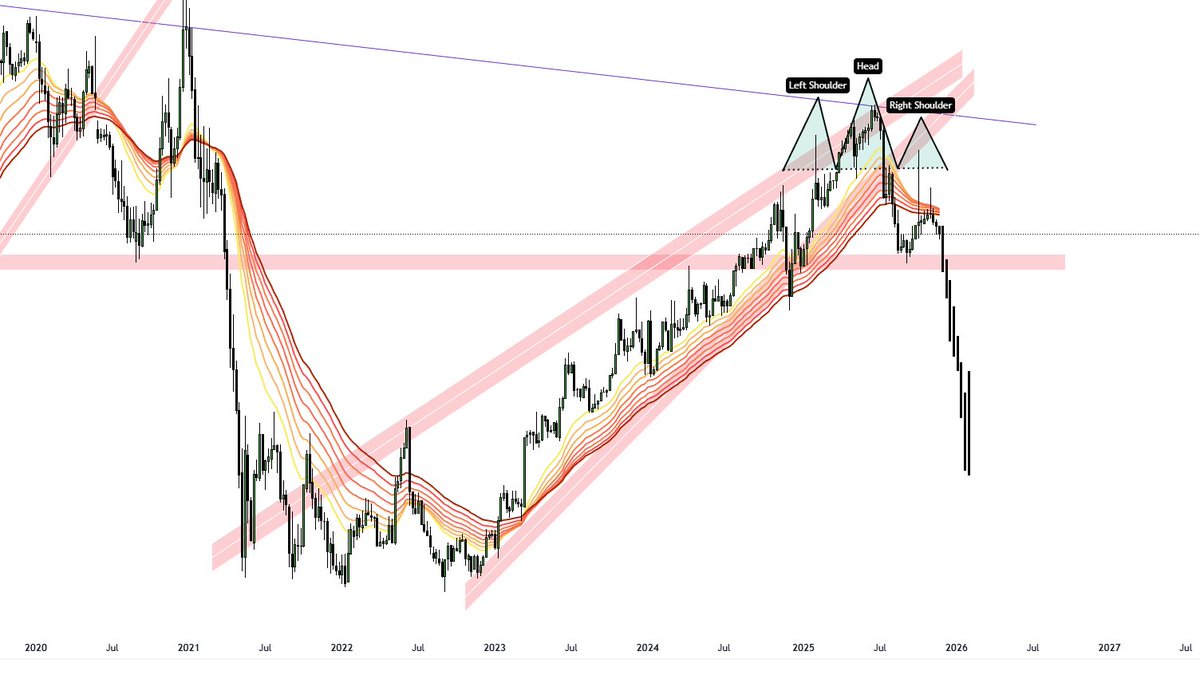
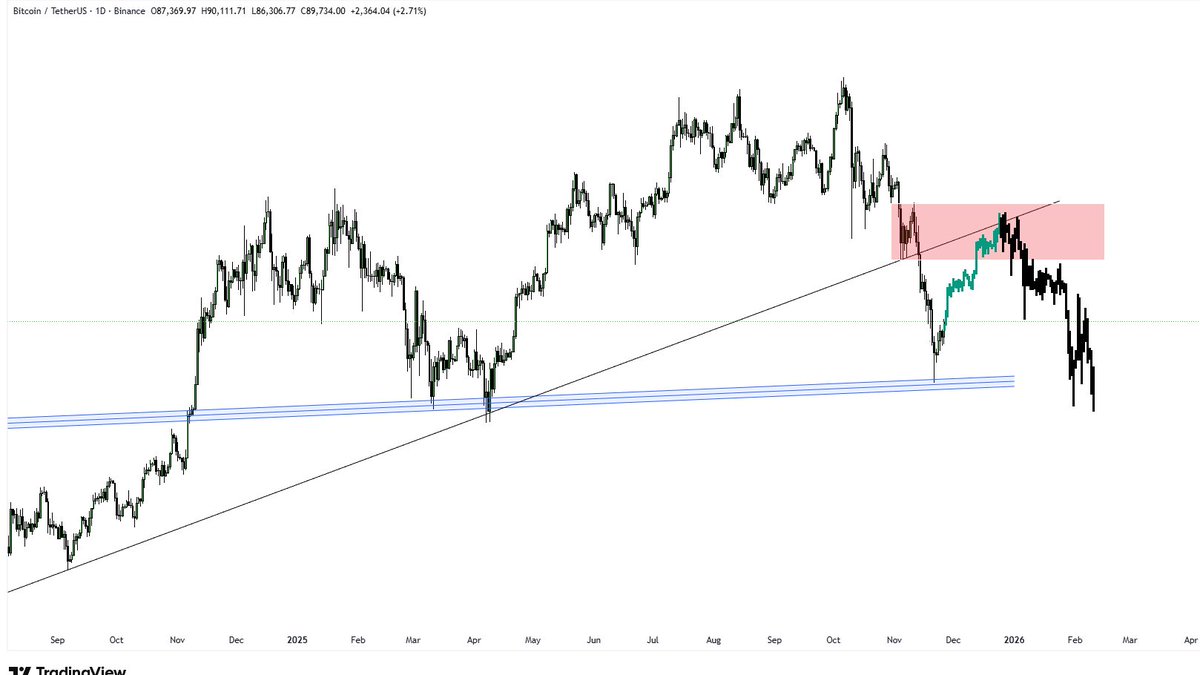
I was analyzing a potential bear flag on Bitcoin today and compared it with the March–April lows. At that time, the market formed a similar structure, resembling a Wyckoff accumulation.
Could the market be forming a comparable setup again? What’s your view?
We’re starting to see not only less selling pressure, but also a clear rise in buying pressure on Bitcoin 📈🔥
Is this the beginning of the big move everyone’s been waiting for… or just another liquidity trap for both bulls and bears? 🤔
Whenever OTHERS/BTC hits this major support, altcoins explode 🚀🔥
BTC.D now shows a possible mid-to-long-term reversal, hinting at another alt move.
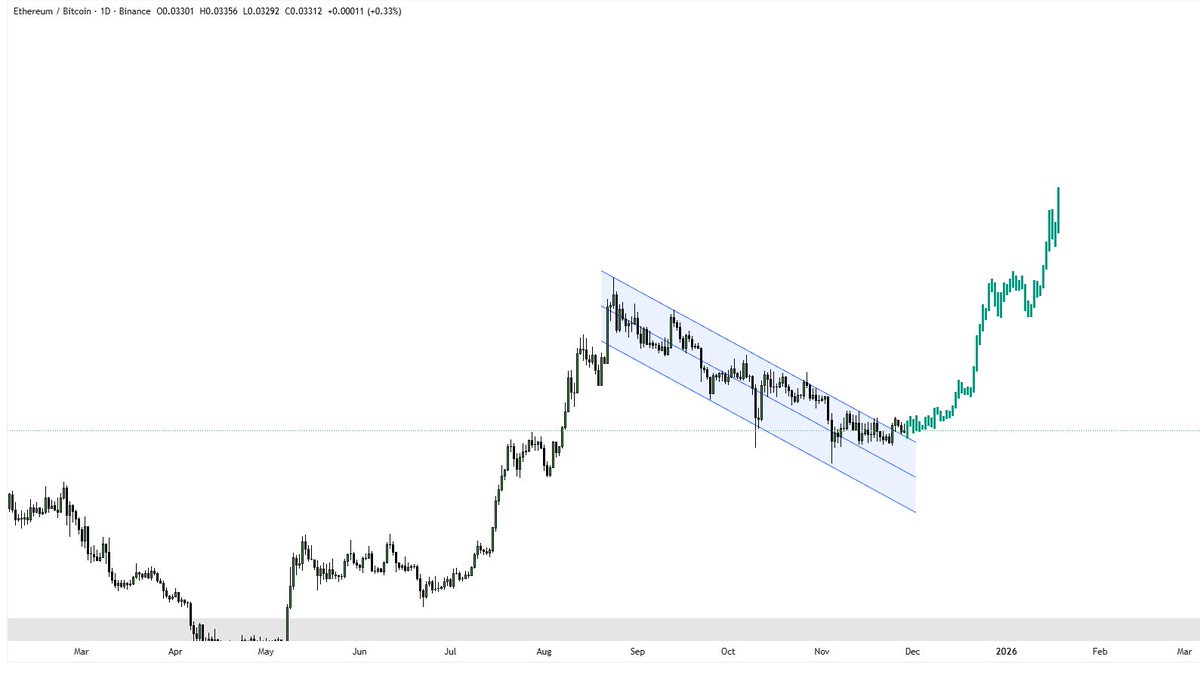
ETH/BTC also forming a potential bullish flag 📈
Will this time be any different? 🤔
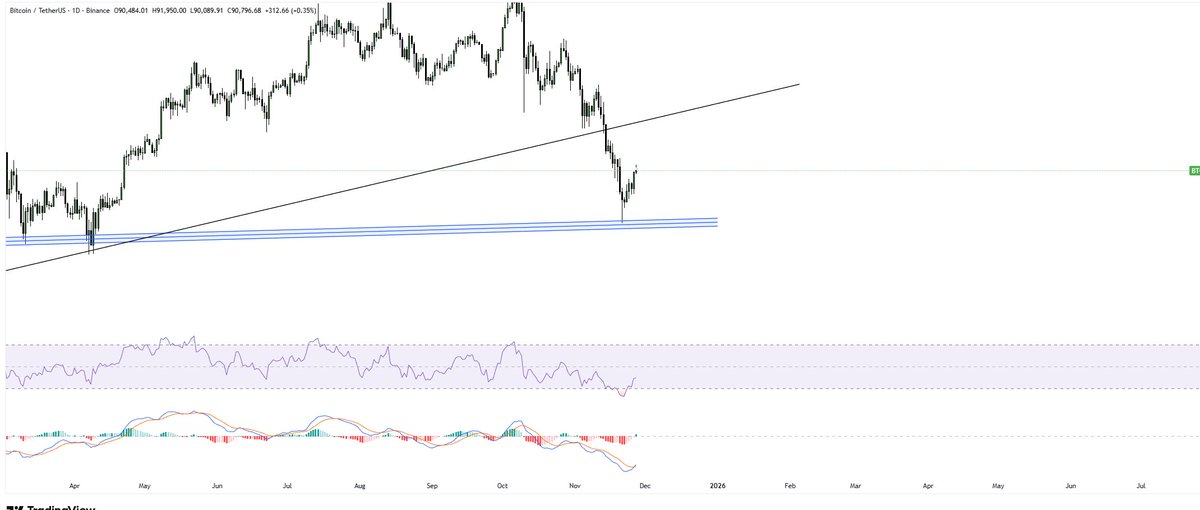
Four bullish signals popping up for BTC in the short term 👀🔥
• 📈 MACD bullish cross on the Daily
• 📉 RSI oversold on the Daily
• 💧 USDT.D oversold + MACD bearish cross
• 🚀 BTC.D starting a possible leg up
With all this... are you leaning bullish or staying cautious? 🤔
The Mayer Multiple is still far from signaling a market top — no overheated signs and no peak conditions 🔥
It leans more toward a buy zone than a distribution phase.
Given this setup… are you buying, holding, or waiting for confirmation? 🤔
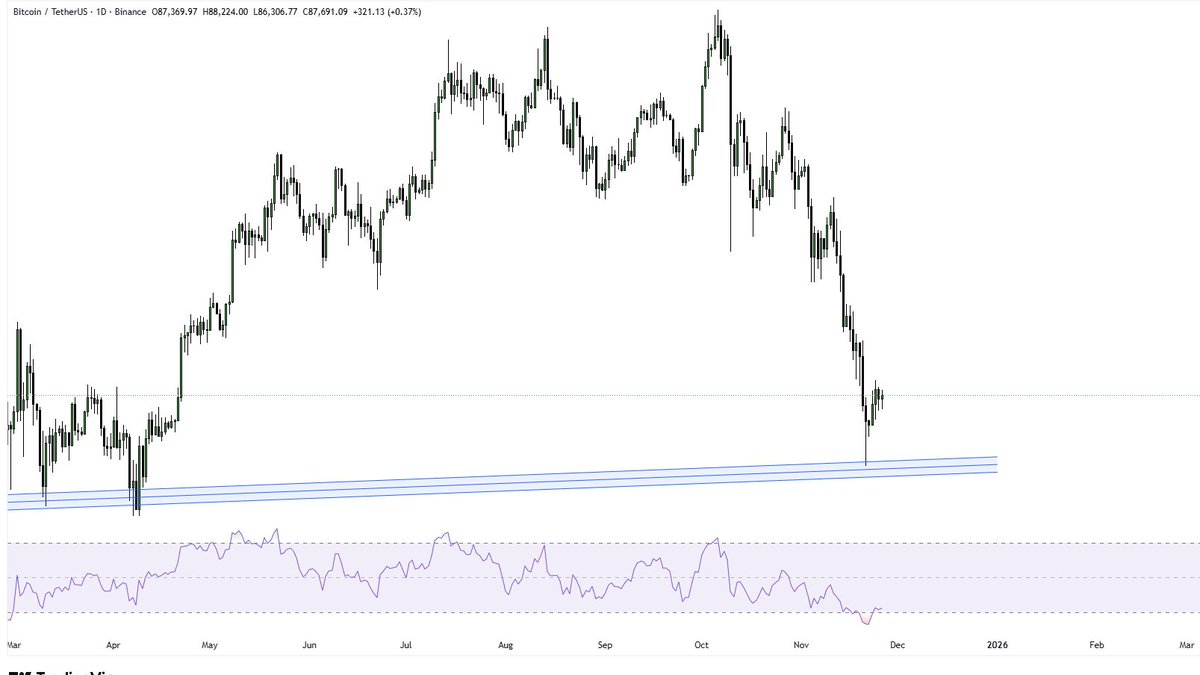
• 📉 BTCUSDT: oversold
• 💵 DXY: overbought
• 🧊 USDT.D: overbought
Watching closely for a momentum shift before calling any reversal.
How are you positioned? 🤔