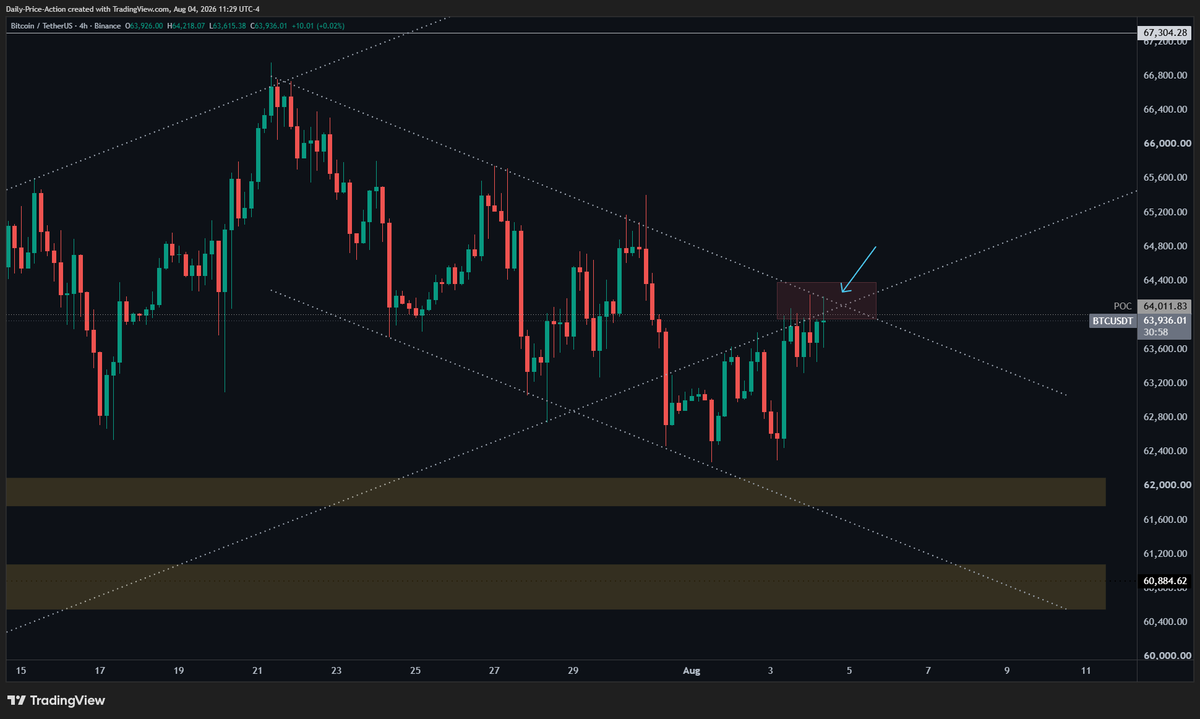
It might be tempting to get bullish with $BTC hovering below resistance for 24+ hours.
If Bitcoin were going to roll over, why hasn’t it dropped yet?
Fair question. But the facts still matter.
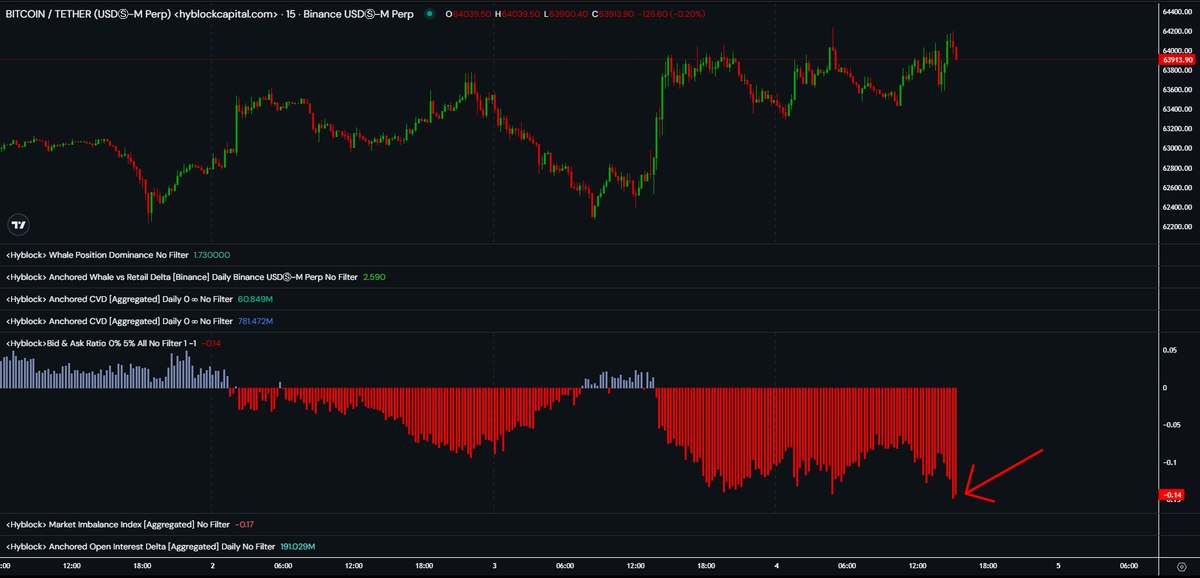
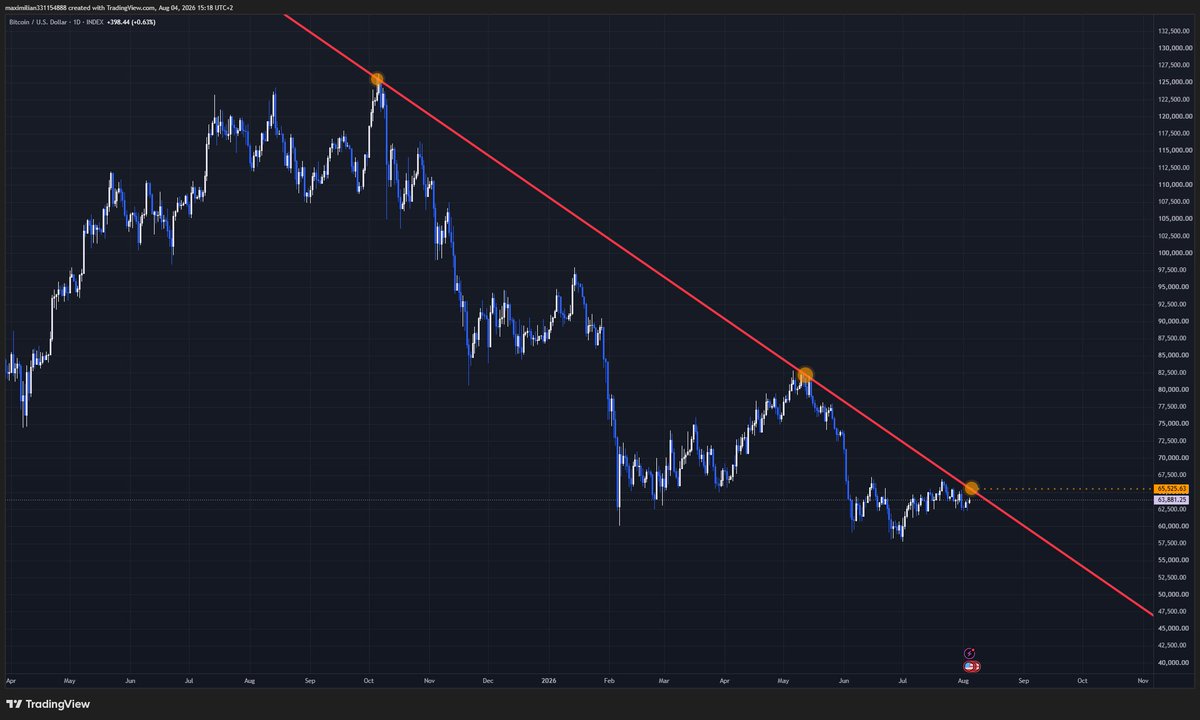
As long as BTC remains below the $64k resistance zone, I think getting bullish is a mistake.
Plus, sellers just stacked the ask again, which is never a good look.
Not aggressively bearish here. Just respecting the data until Bitcoin proves otherwise.
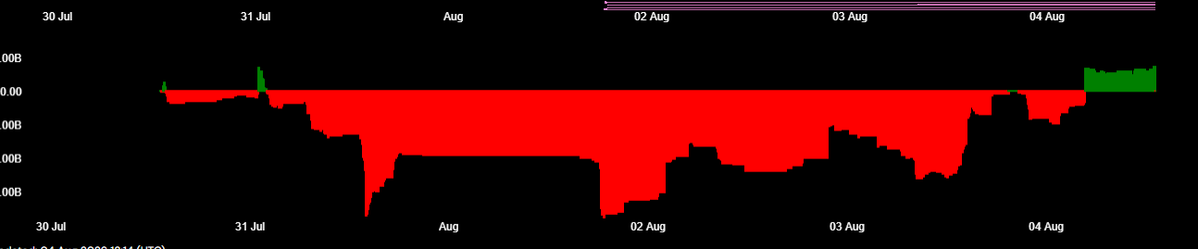
first time in a while we have a green delta again. complacency has taken hold
Once this delta gets a bit more green the nuke will hit fast. It 100% begins this week
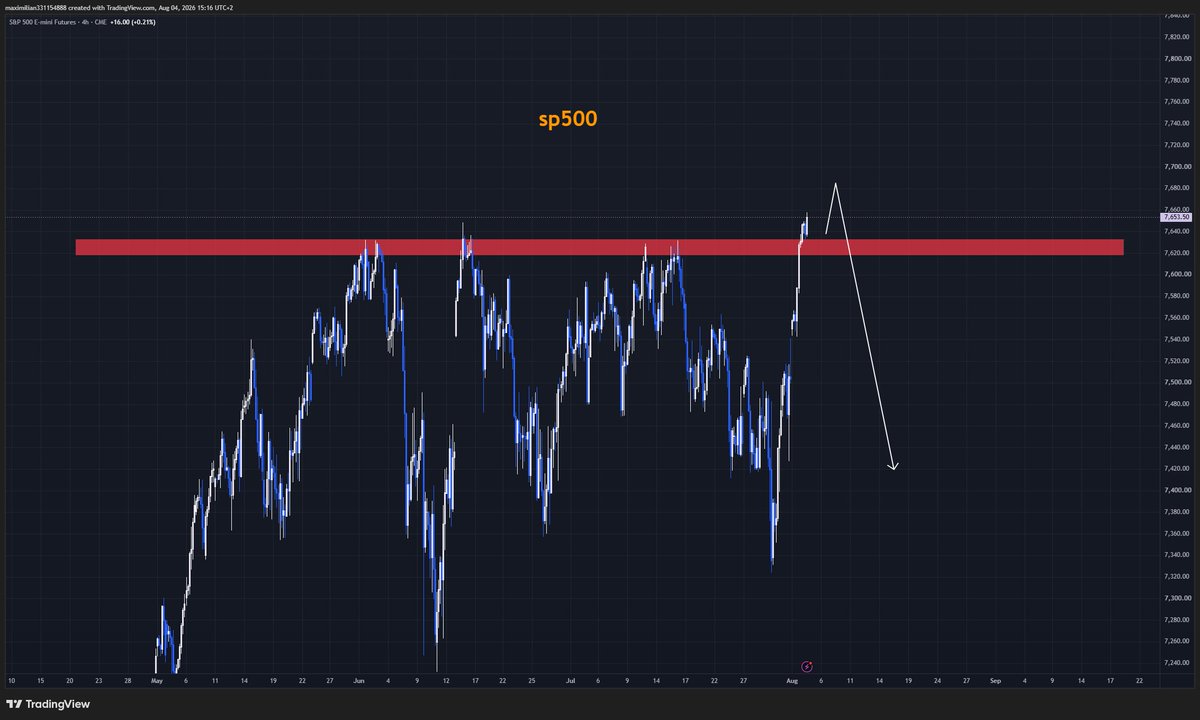
sp500 futures has created a new ATH and will SPF shortly
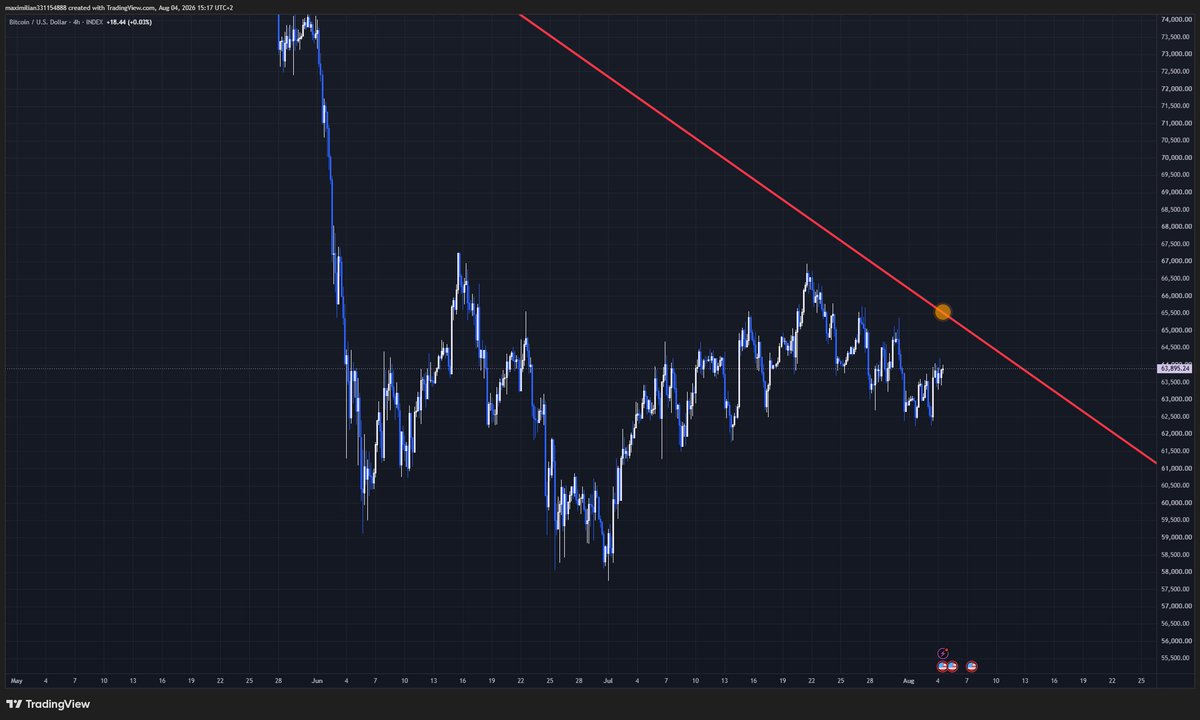
if btc decides to have one last push today - 65.5k is the absolute max give or take 200 dollars i can see happening.
Stay vigilent. we are painfully close to the rollover.
Do not succumb to fomo
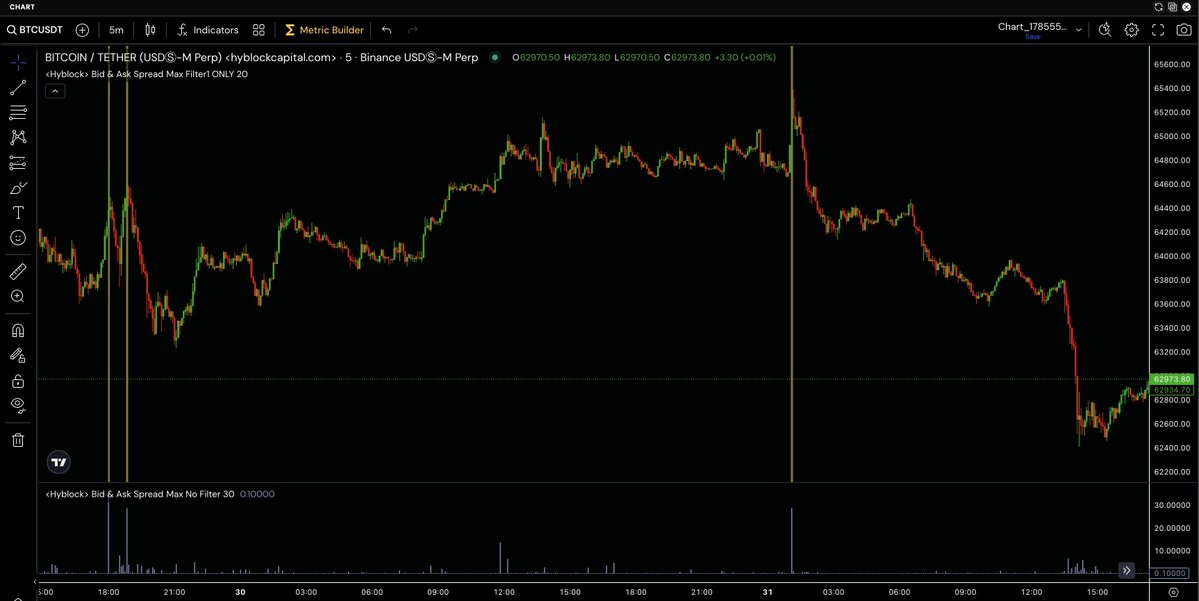
The famous bid ask spread now available on any ticker, up to 3 years of historical data (via MCP / API).
Find gaps in liquidity and more importantly the moment MMs pull back.
Bid Ask Spread = (best bid ask price in the book) - (best bid ask price in the book), measured at every OB tick change.
Users can filter by Max(bid ask spread) during that candle or Avg(bid ask spread) during that candle.
This is the stuff that institutions request.
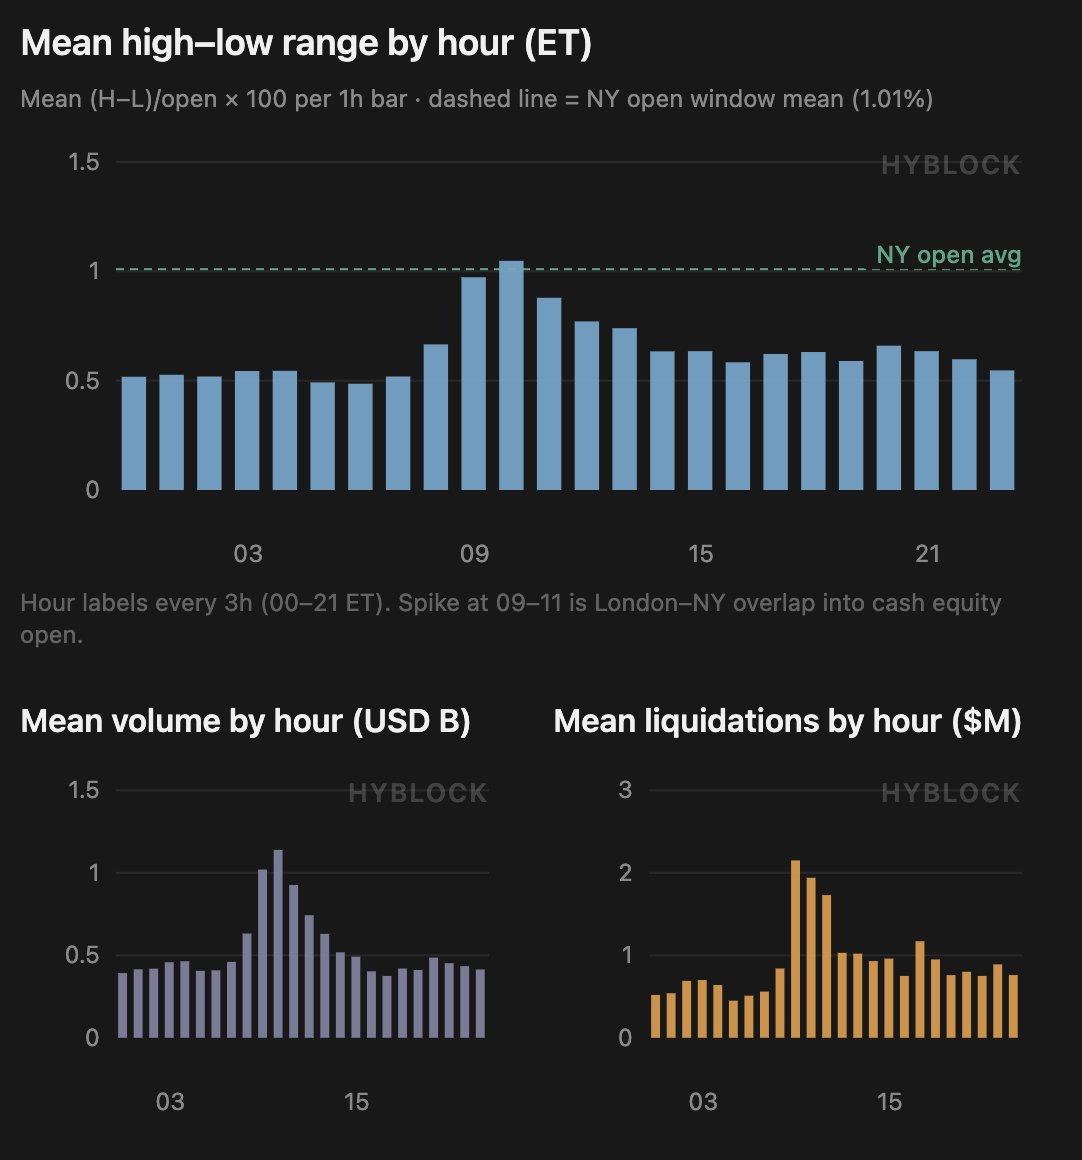
As we approach the NY open, friendly reminder that NY open is real and it's the possibly the best hour of the day to trade.
Over the last 12mo, the 09:00–11:00 ET (13:00–15:00 UTC) window averaged 1.01% high–low range vs 0.61% for all other hours (+66.6%), with 2.2× the volume and ~2.5x the liquidation USD.
Peak hour is 10:00 ET (not 09:30 itself on this 1h grid).
Quietest stretch is London morning (05–06 ET), not the US afternoon.
We checked the old “Monday sets the week” rule on BTC.
Mon high = weekly high 38.5% of the time
Mon low = weekly low 25% of the time
note: true baseline randomness would this at 1 out of 7 (14%) and if we assume weekends are low volatility and exclude them, then 1 out of 5 (20%).
Highs are still a real bias.
Lows are weaker.
Friday often takes the weekly low in a Mon–Fri frame.
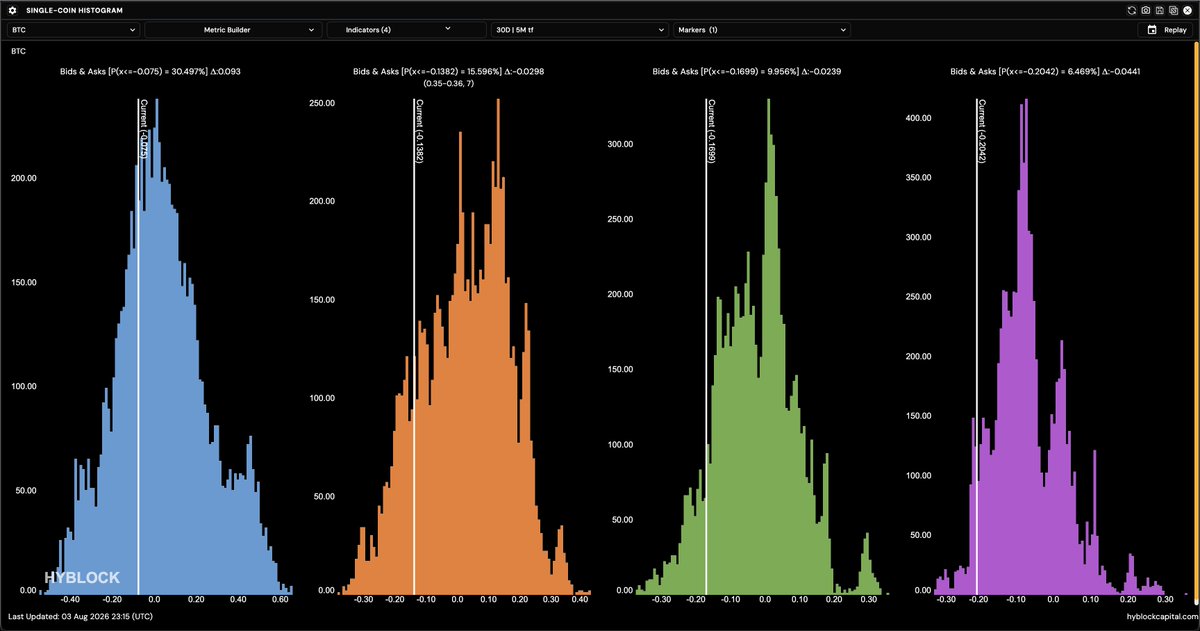
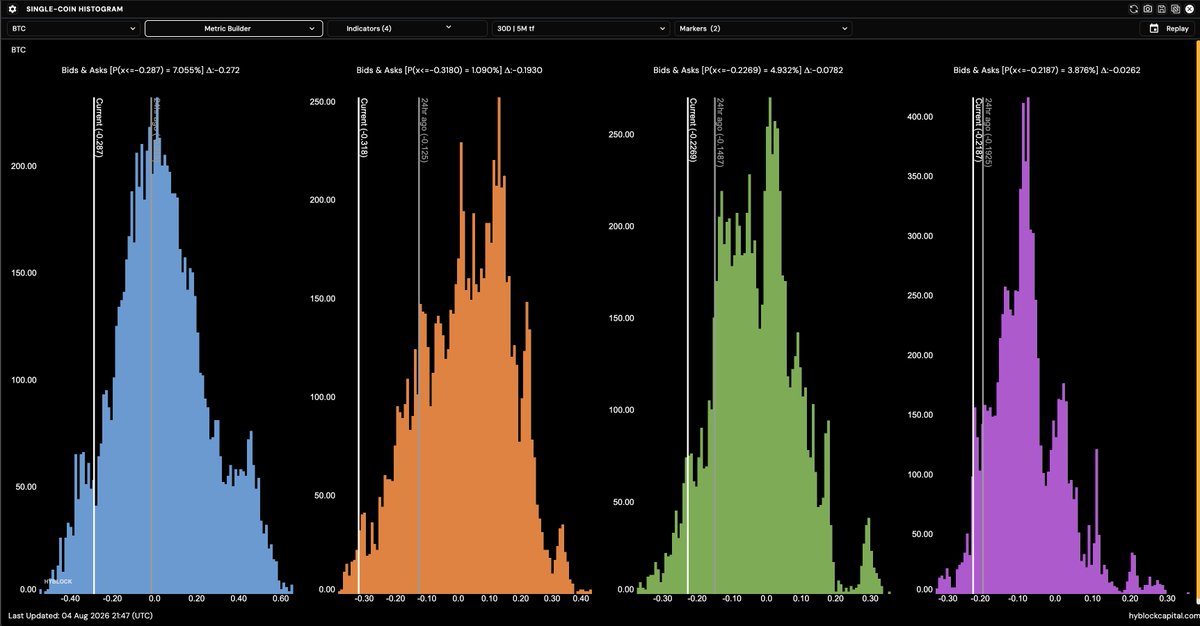
Binance stablecoin perp bid ask ratio's are reaching 30d outlier levels:
0-1%: 30th percentile (not yet)
0-2%: 15th percentile (low)
0-5%: 9th percentile (very low)
0-10%: 6th percentile (very low)
94% of the time, the bid ask ratio on the 10% depth is above the current value.
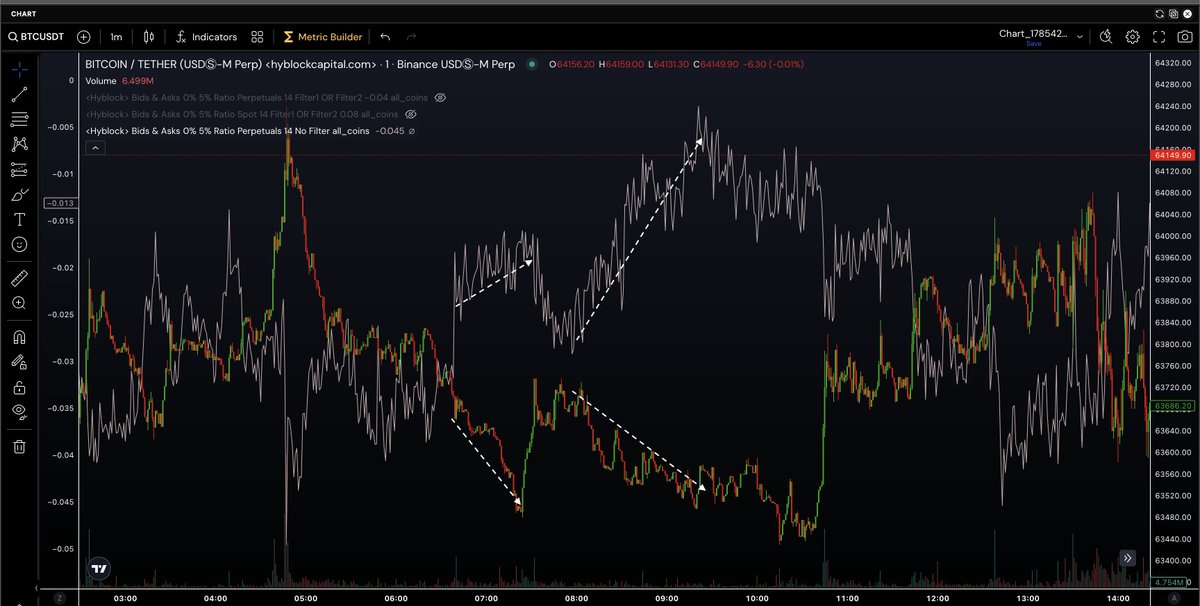
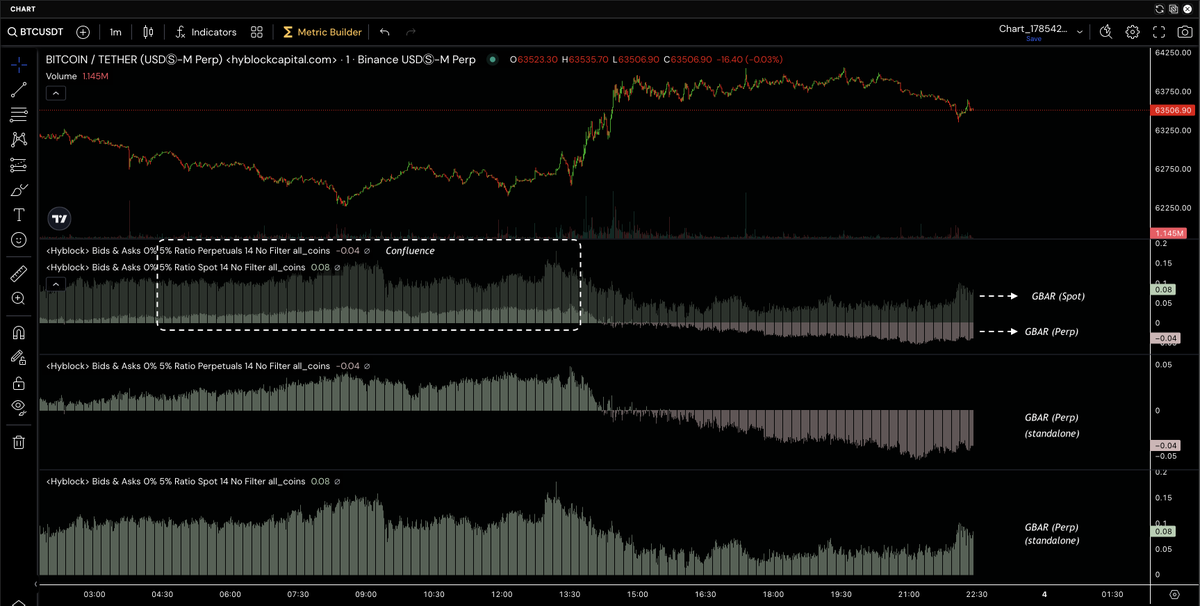
Global Bid Ask Ratio (spot v perp).
We had pretty decent confluence (spot GBAR > perp GBAR, with both positive).
Then we see the mini-pump (note: 1m timeframe).
Now, GBAR perp is red (limit sell pressure), while GBAR spot is still green (limit buy pressure).
Divs not just in anchored CVD but OB as well.
*for first time readers, global here is defined as aggregation across entire crypto universe (hundreds of tickers including btc, eth, sol, xrp etc.). here we show 0-5% depth of the orderbook (OB).
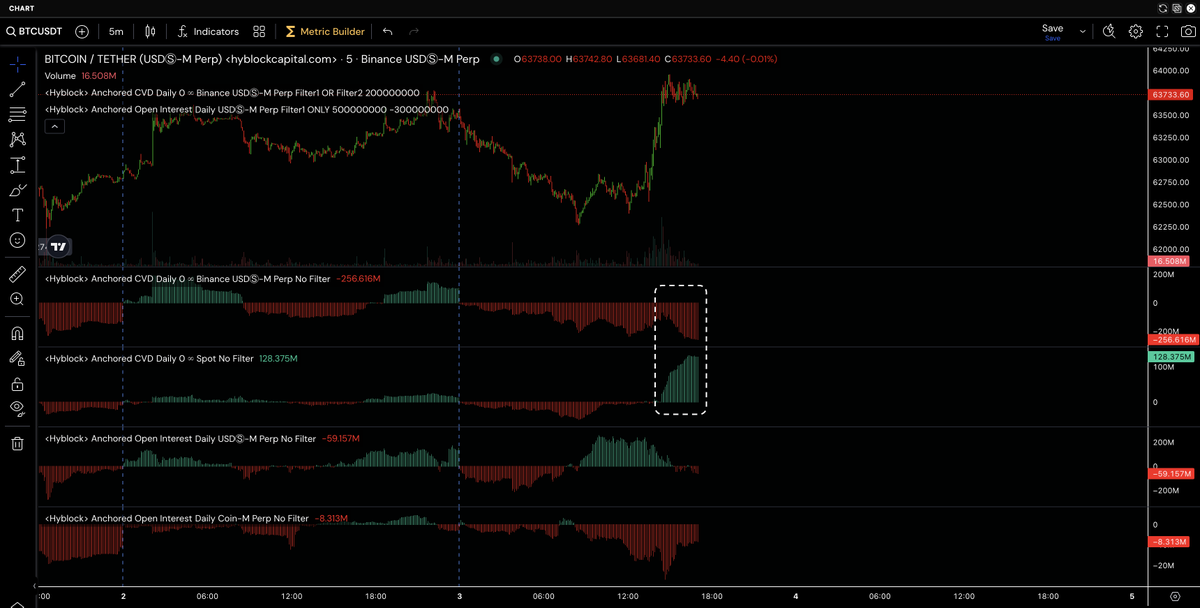
Well that didn't take long. Spot CVD is active today.
even more interesting, strong divs on perp (binance) cvd and spot cvd.
and within perps: stablecoin-margin perp OI decreasing while coin-margin perp OI increasing.
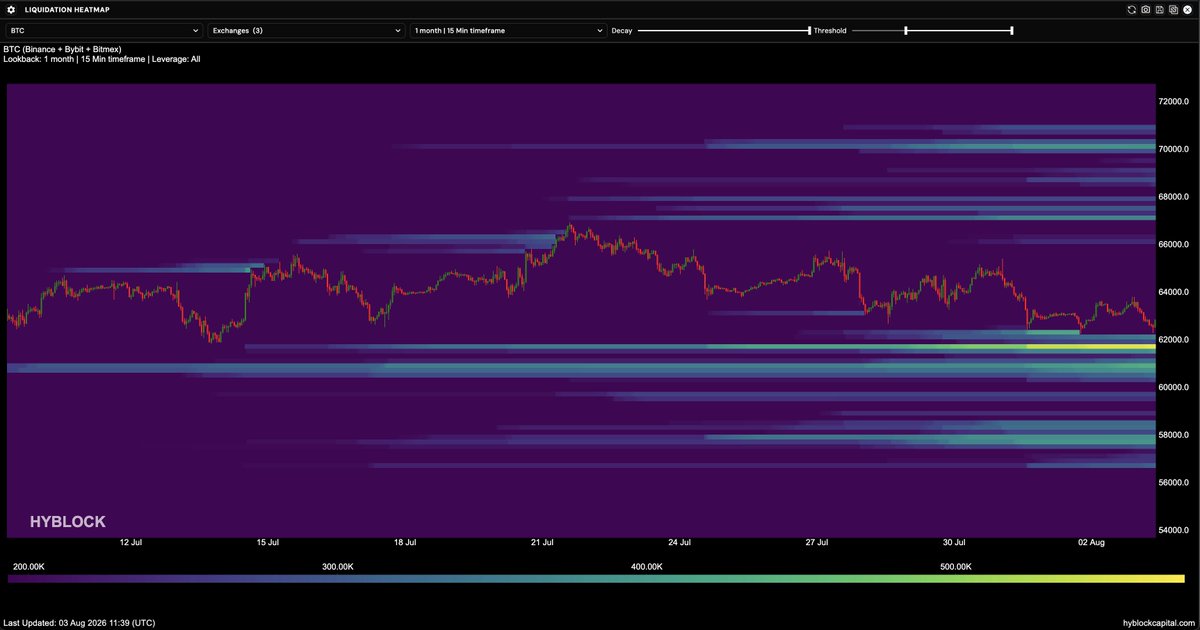
This is the level to keep an eye out on today.
Anchored spot CVD almost back up to positive levels despite price being much lower (spot divergence).
Also an area with increased open interest (psychological "breakeven" level if price revisits)
This is the level to keep an eye out on today.
Anchored spot CVD almost back up to positive levels despite price being much lower (spot divergence).
Also an area with increased open interest (psychological "breakeven" level if price revisits)
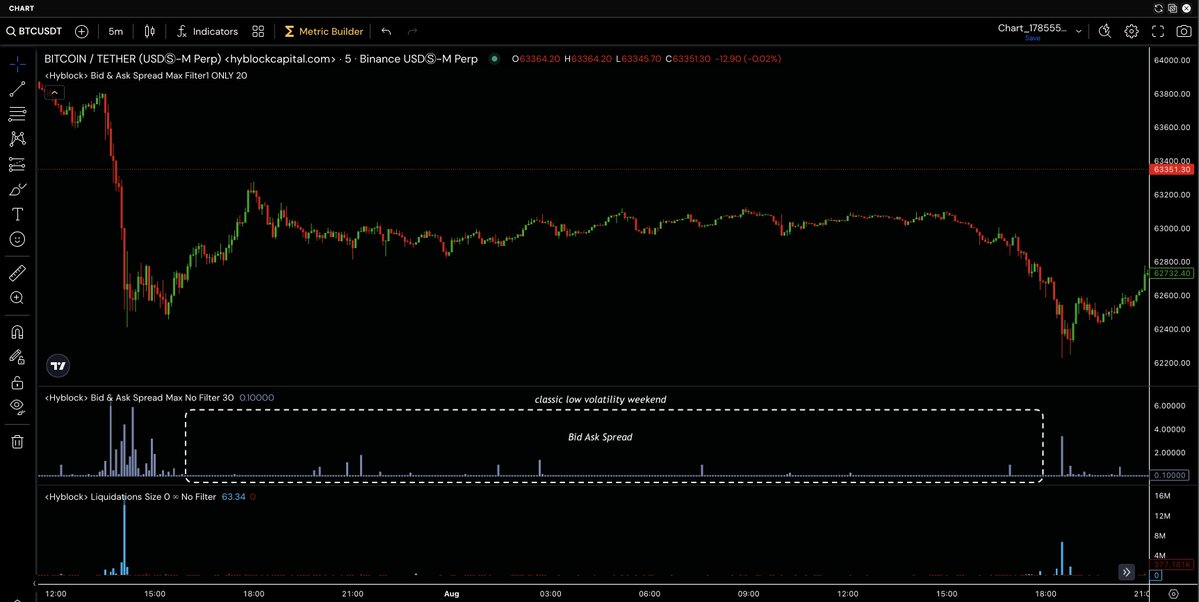
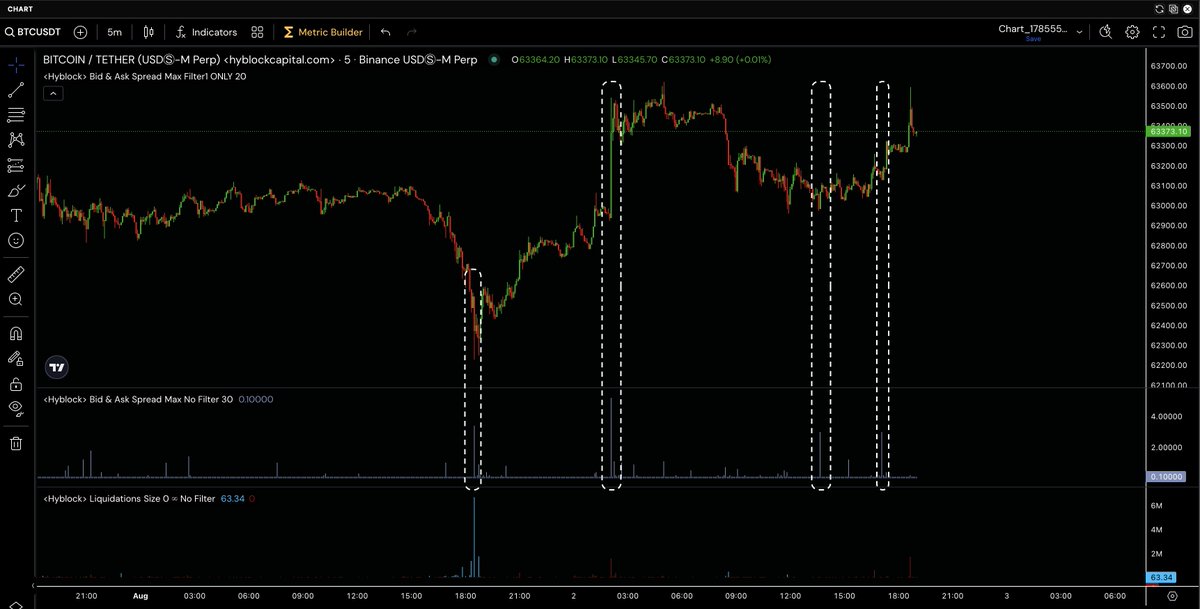
bid ask spread often signals end of a local moves.
*bid ask spread = (best ask price - best bid price).
on every orderbook event, we measure the spread. Usually that spread sits at 0.01 for btc on binance
here is an example illustrating that:
last traded price: 63205.72
best ask price: 63205.73
best bid price: 63205.72
bid ask spread = 0.01
we keep tracking this continuously and then measure the maximum spread that occurred during that candle (and also the average spread).
Available via MCP/API. 3+ years of historical data on a 1m timeframe across many exchanges and many tickers. Enjoy.
In 1915, Einstein published Theory of General Relativity, probably the single most important event that accelerated the rate at which humankind moved forward.
100+ years later, we are once again in an Einstein level moment.
The AI trade looks far from over.