Hidden in plain sight. The Trump playbook.
I'm half kidding, but look at this.
March 2018 (Trump's first midterm year) vs March 2026 (his second). Both sold off hard late in the month. The reasons are different but seeing them side by side is pretty interesting.
I put this chart together because I wanted to see it for myself.
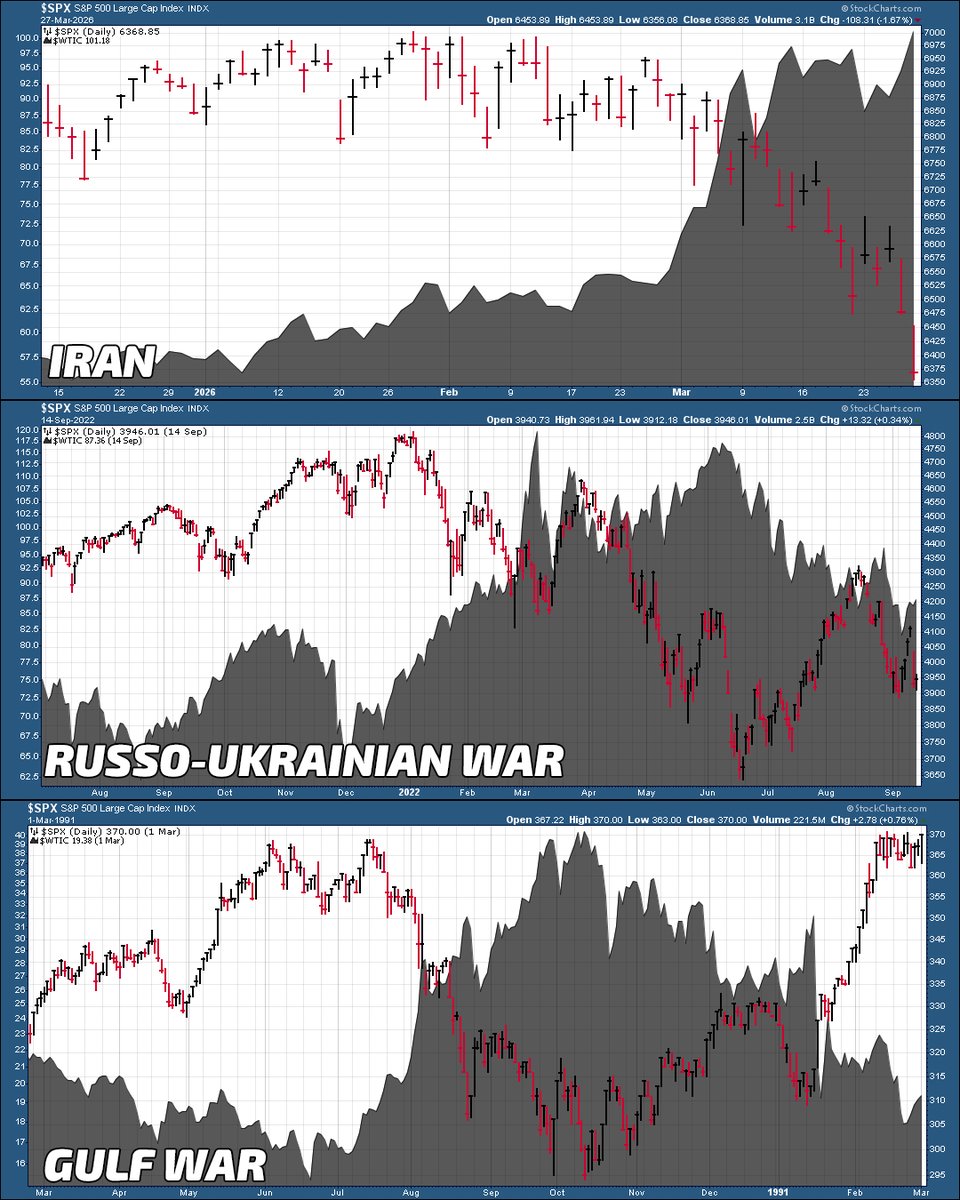
$SPX vs oil ($WTIC) during three different geopolitical events. Gulf War. Russia/Ukraine. And now Iran.
When oil spikes hard on geopolitical risk, equities tend to run into headwinds. And when oil cools off, the market tends to find its footing.
It's not meant to predict anything. I just think rising oil during these events gives you a really clean read on when the market might start running into headwinds.
Here's where the "Great 8" are sitting inside their weekly expected moves right now.
These are the options-derived ranges the market is pricing in for each name this week. The orange lines are the upper and lower bounds.
$NVDA — 164.26 / 181.14
$GOOGL — 290.40 / 311.60
$AAPL — 239.85 / 256.13
$MSFT — 369.60 / 394.14
$AMZN — 197.08 / 213.66
$META — 569.65 / 617.67
$AVGO — 292.92 / 328.10
$TSLA — 346.65 / 389.27
NVDA and TSLA already tagged their upper expected move this week. GOOGL and MSFT tagged their lower.
The pain trade right now (imo) is a new all-time high.
Based on what I'm seeing, a lot of very smart people are confidently positioned/prepared for lower. The consensus feels almost unanimous, "the market will go down from here."
And maybe it does.
But Walter Deemer said it best: "The stock market will do whatever it has to do to embarrass the greatest number of people to the greatest extent possible."
Right now, the move that would cause the most pain isn't another leg down. Everyone's already braced for that. The real pain trade is missing a move up that nobody was positioned for. Including myself at the moment, haha.
Not saying it happens. Just saying, when this many people are sure about the direction, that's usually when the market decides to do the opposite.
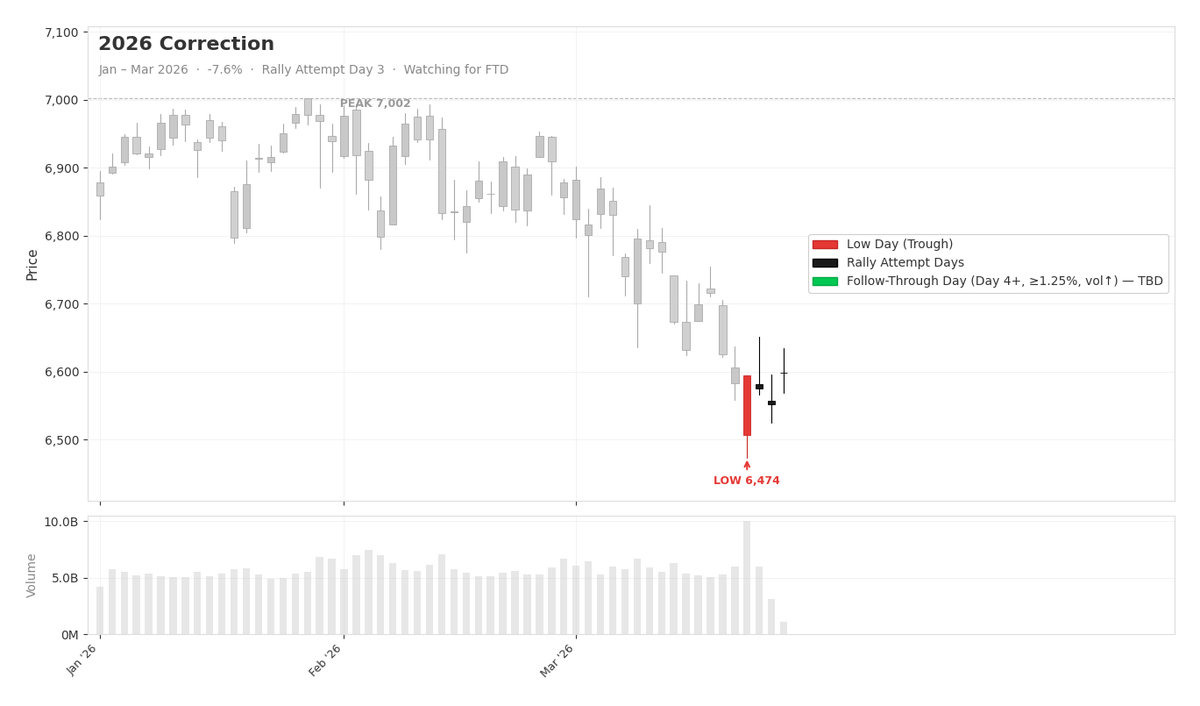
The $SPX low on March 20 is now 3 days old and hasn't been taken out.
That means we're in a live rally attempt, and starting tomorrow, I'm watching for a Follow-Through Day, a +1.25% gain or more on higher volume than the prior day.
Still very early and this hasn't even been a -10% correction yet. But if one shows up without the low getting taken out, that's the signal to start adding some exposure into names showing relative strength.
After a Follow-Through Day, the warning sign is if that FTD low gets breached. Doesn't kill the rally, but it means manage your risk.
I charted every correction over the last 20 years and how this signal played out each time 👇
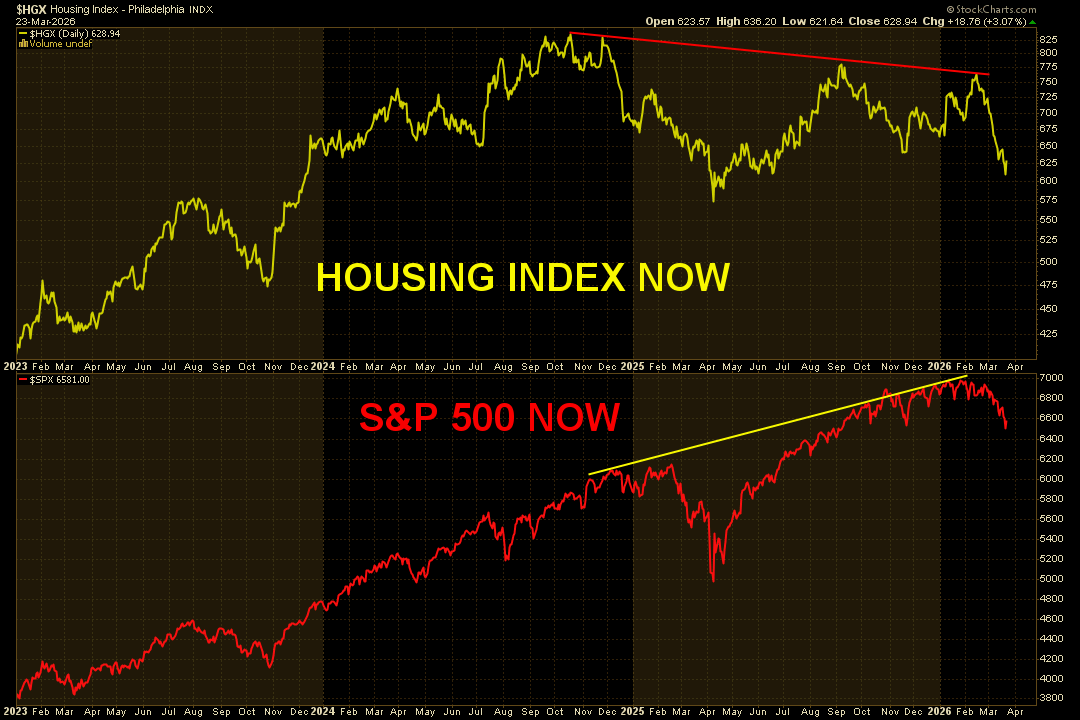
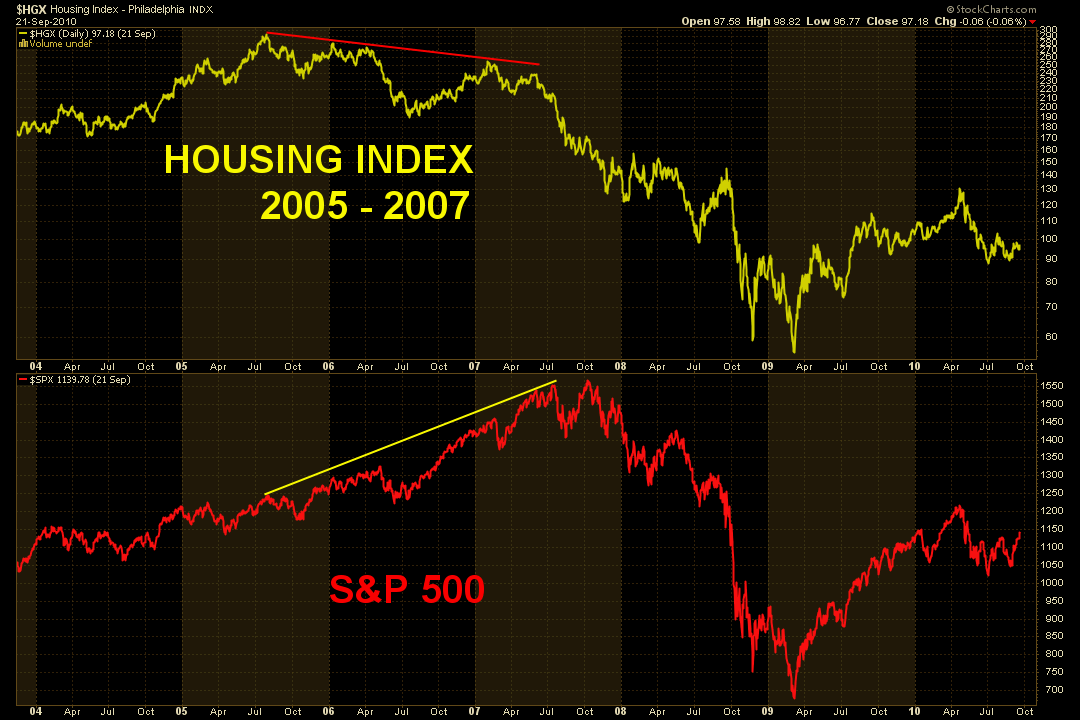
Nobody’s really talking about this divergence.
In 2005, the Housing Index topped and quietly bled lower while the S&P kept making new highs for over a year. That wasn’t “the cause” of the financial crisis, but it was one of the cleaner tells that something under the surface had already broken.
Today we’re seeing a similar pattern: housing (yellow) has been trending down while the S&P (red) pushes to new highs again. If this ends up mattering, it will be considered obvious in hindsight. If it doesn’t, it’s still a good reminder that important sectors often rolls over long before the index does.
I’m not making a crash call here, I just like keeping an eye on the parts of the market that stopped agreeing with the headline narrative a long time ago. That’s where the best signals usually show up first.
The market doesn't care about your narratives and it never has.
You control exactly four things: what you buy, when you buy, how much you buy, and when you sell. That's it.
Get better at controlling those four things. Stop letting narratives cloud your decision making around the only things you actually have power over.
Stop blaming tweets, pointing fingers, and getting emotional instead of facing the person in the mirror.
The market will reward the people that focus on preparation and process and use the ability to change their mind as a competitive advantage.
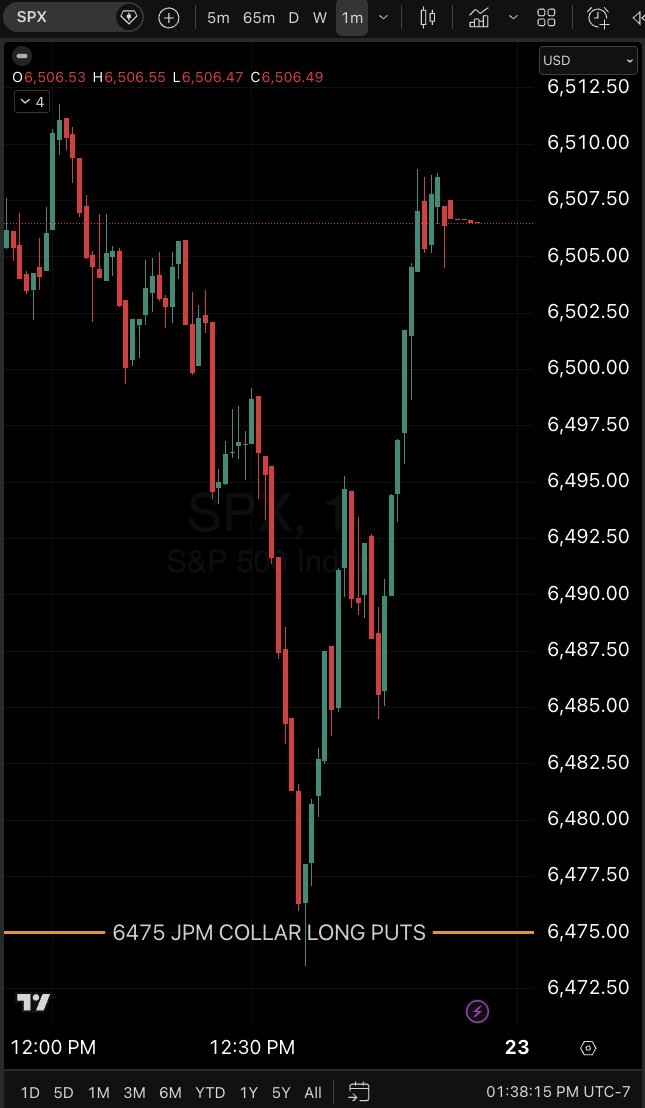
Everyone's staring at the powerful move this morning but almost nobody is looking at why it's happening.
$SPX has been under the gamma flip line and this is textbook behavior when that happens. The volatility, the chop, the shakeouts, none of this is random.
I scaled into a S&P 500 position Friday because I could see the setup forming for a bounce. I sold some into this morning's pop, then used my $TICK indicator to scalp a few points off MNQ when it printed a -1000 extreme reading a few times today.
If you want this tool and a breakdown of what it is, its in the thread below.
How are you taking "calculated risks" if you're not actually calculating risk?
One command inside my Discord and I've got next week's expected moves for $SPY, $QQQ, and $IWM, whether implied vol is running at a premium or discount, and I can plot these levels straight on my charts or get DM'd when they're hit. I also built a live alert system that tracks over 700 equities and notifies you when their expected moves are tagged in realtime.
I built this tool for myself. It costs me a lot to develop and keep running, but it's become one of the best parts of the server, and it's just one of many features members get.
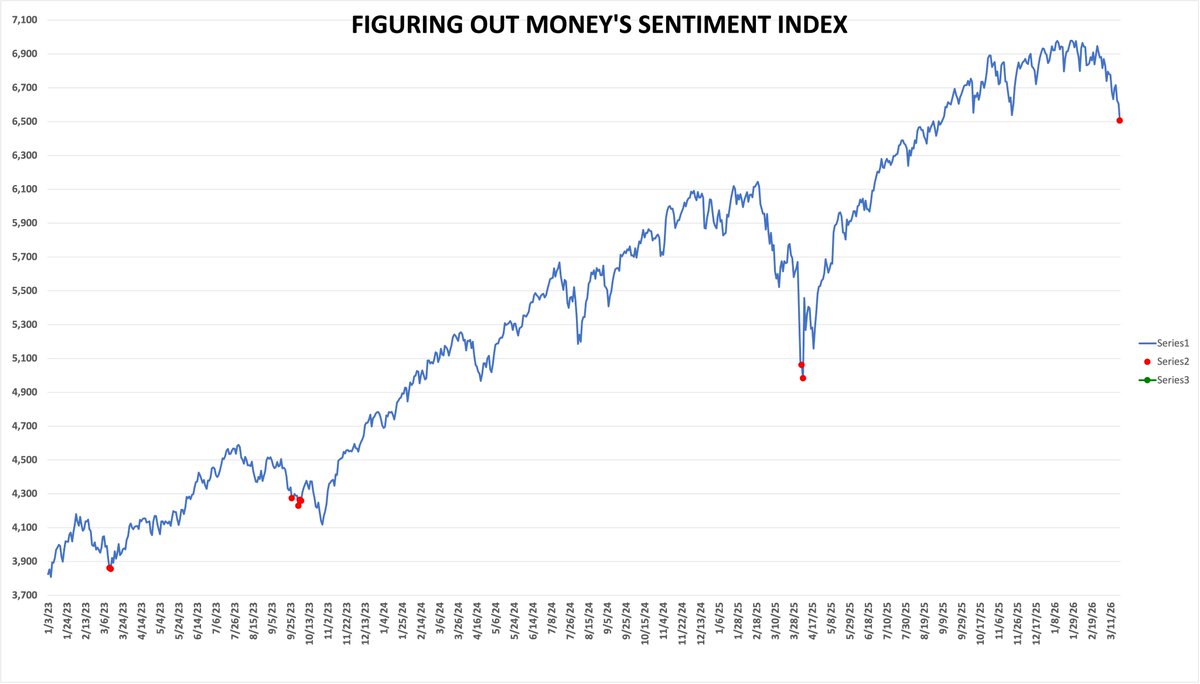
This is where the market can usually fools the most people.
My sentiment index just printed 9.5. That's the lowest reading since the April 2025 bottom when it hit 6.5.
Every red dot on this S&P chart marks a reading below 9.6. Look where they land. Every single one caught a major low.
If you're very bearish right here, just know that some of the most violent face-ripper rallies happen in bear markets. That's not a bug, that's the feature. The crowd gets max bearish right before the snapback burns them.
Not calling the bottom. Just saying readings like this have a way of making the bears pay just as much as the bulls.
Everyone wants to be bearish until they realize what bearish actually looks like and how difficult it is to be a successful permabear.
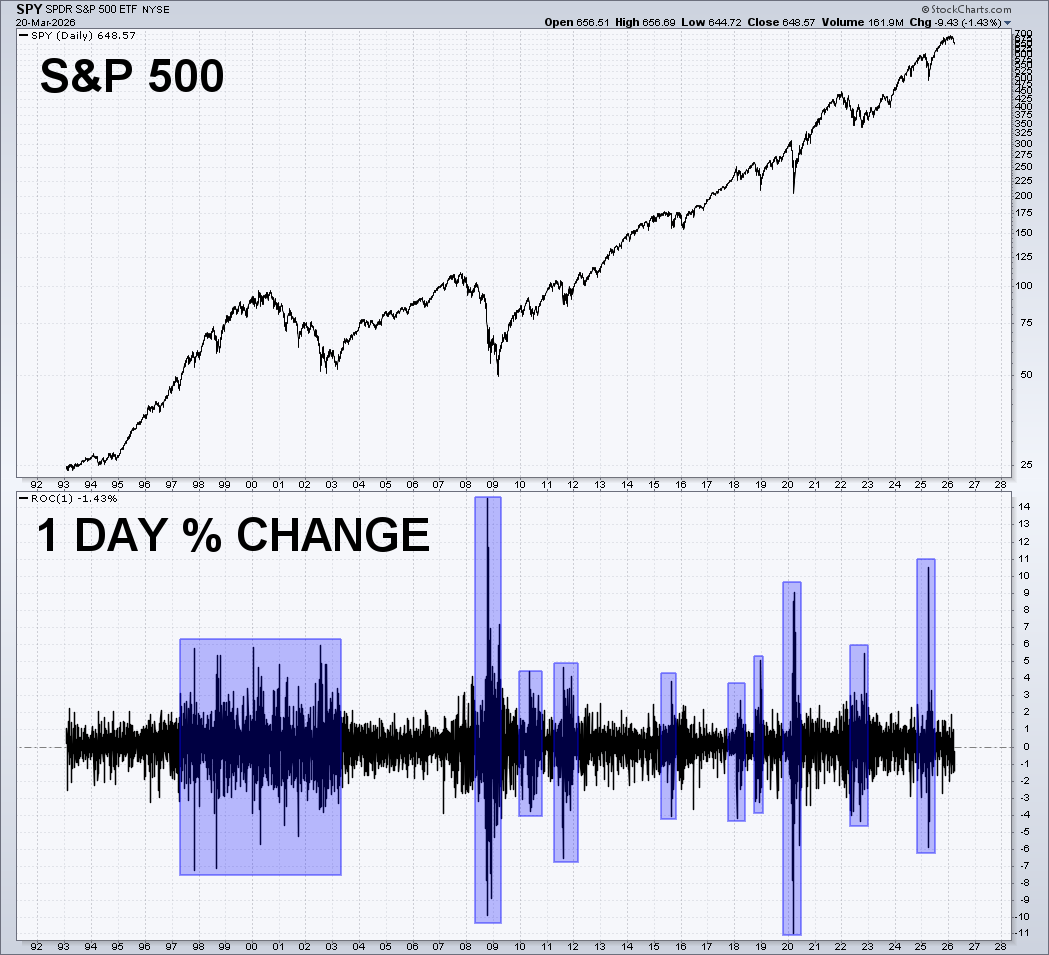
It's almost never just a slow bleed, it's chaos in both directions. The biggest up days and biggest down days happen right next to each other. Look at the volatility clusters on SPY's 1-day ROC. Calm markets go up. Volatile markets will slingshot you around like a rag doll if you're not prepared.
Conclusion: If you are very bearish right now...Then you should be expecting some violent trade to the upside as well.
This is the chart I keep pulling up when people ask me if I'm worried.
These are the Great 8 in the S&P 500 and their weekly expected moves. Despite everything going on (Fed, headline risk, etc.) every single one of them is still trading within its projected range of risk.
$MSFT is the only one that actually tagged the lower weekly expected move. $TSLA got close. The rest? Contained.
Scary headlines. Priced-in moves. Market still acting very efficient.
This is really impressive to me given that $VIX futures curve is in backwardation, $SPX is under the flip line, breadth has been deteriorating, and I could keep going.
These market conditions don't favor my main style of trading, which is breakout swing trading. I end up getting more fakeouts and shakeouts. So I trim my position sizing when I see setups I like in terms of breakouts, and spend more time focusing on fading extreme moves because that works better for me in this environment.
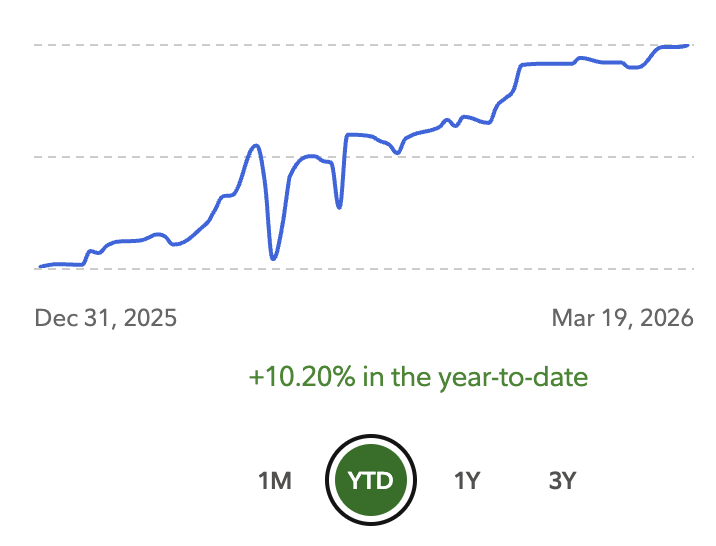
Here is my PnL curve that gets verified in the USIC. I recently added some exposure to $SPY , not because I think we’re going to break out to new highs overnight or anything, but simply because we just came under what the market priced in for risk this month.
So in short, I protected my money on this down move. Now I’m looking to see if we can get a little bounce, perhaps to 6800-ish, but I’ll adjust as new data comes in.