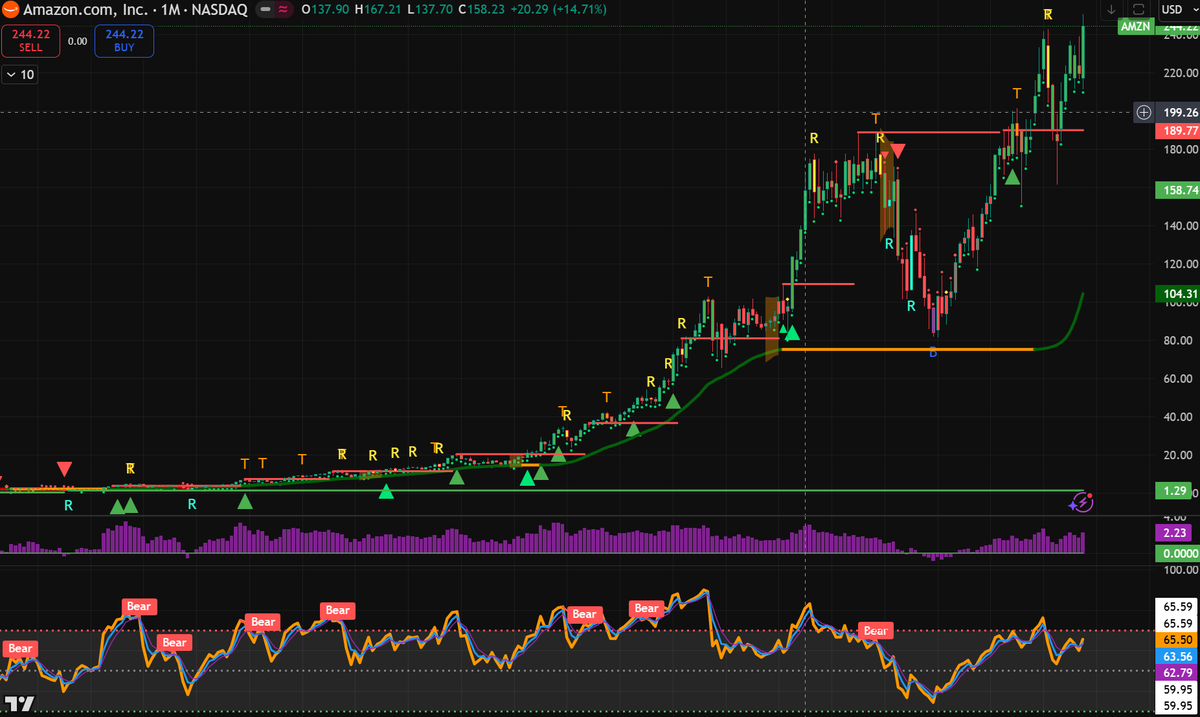
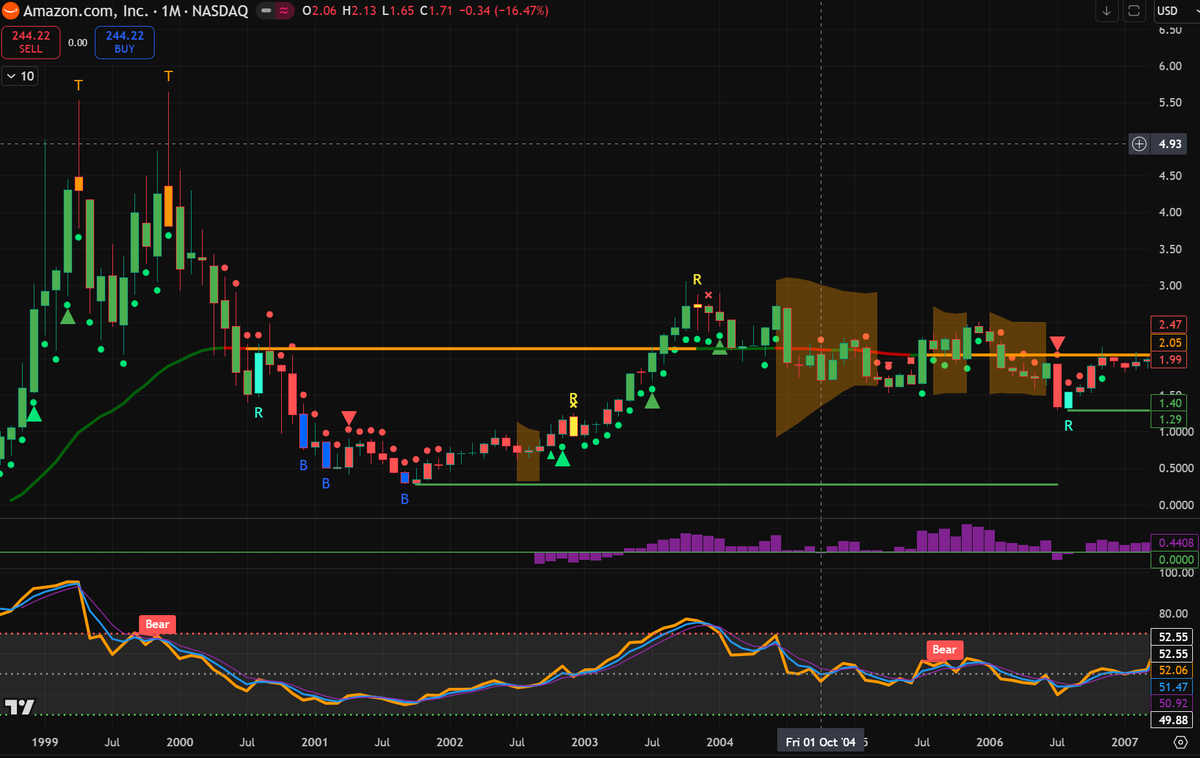
Take a look at these charts. One of them looks almost exactly like the #Bitcoin chart from 2017 (chart from dot com bubble). The other one is that same chart through the current day.
Could the Amazon chart show us where $BTC will go over the next decade? $0.28 -> $250.50
The same performance from the low of $3500 in 2019 would result in a $14,000,000 price by 2043. This may seem crazy, but it's happened before with $AMZN and probably others.
#Not2Late
@ZeroHedge_ This is what happens when you tell the world that your model will break the world and kill everything. The government takes you seriously and uses a heavy hand just in case you're right.
@ThePrimeagen Why are you using the terminal? The UI is so beautiful you should never have a desire for anything else... you can't even buy espresso on the terminal..... shop
What happens if someone with a quantum computer decides to do something else.
What if they decide to wait for the next difficulty calculation, then mint all the block for the next period in an instant.
The difficulty would go to unusable levels and BTC blocks would stop.
This is the thing I'm worried about.
@CryptosR_Us@ctoLarsson Is this apples to apples? The crypto side probably counts every single transaction. ACH is one small part of the whole.
It's a step, but there's still a long way to go. I'm about to pay for breakfast with the old system.
@100trillionUSD It seems to be that Bitcoin and crypto in general is at the top of the S curve when it comes to awareness. Because of this, the excitement we normally see around new people finding the asset is tailing off.
I'm guessing that this means a more even but strong adoption over time.