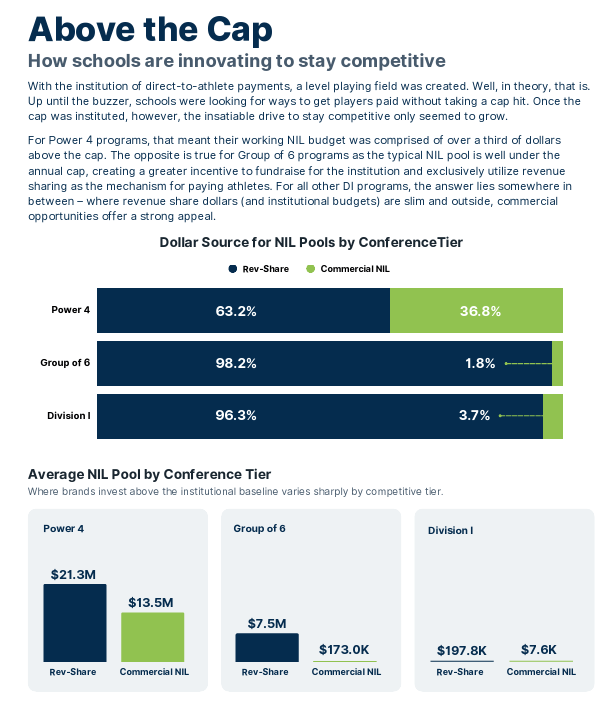
This time last year, schools began spending up to the $21.3M revenue-sharing cap.
But it doesn’t stop there.
Download the 2026 Annual NIL Report to see where the money is coming from. https://t.co/j16DRjU4JJ
A year ago, we projected the NIL market would reach $2.8B this year.
We were wrong.
Not because the market softened. Because it grew faster than almost anyone expected.
Opendorse's annual NIL report estimates that more than one-third of Power 4 NIL money comes from above the cap dollars.
States the total average Power 4 NIL budget, including above the cap, is:
Big Ten: $48.2M
SEC: $44.5M
ACC: $29.4M
Big 12: $24.3M
https://t.co/P0jTd9jOYp
Opendorse has released its annual NIL report. A few interesting nuggets:
- 36.8% of P4 deals are above the cap vs. just 1.8% in the G6
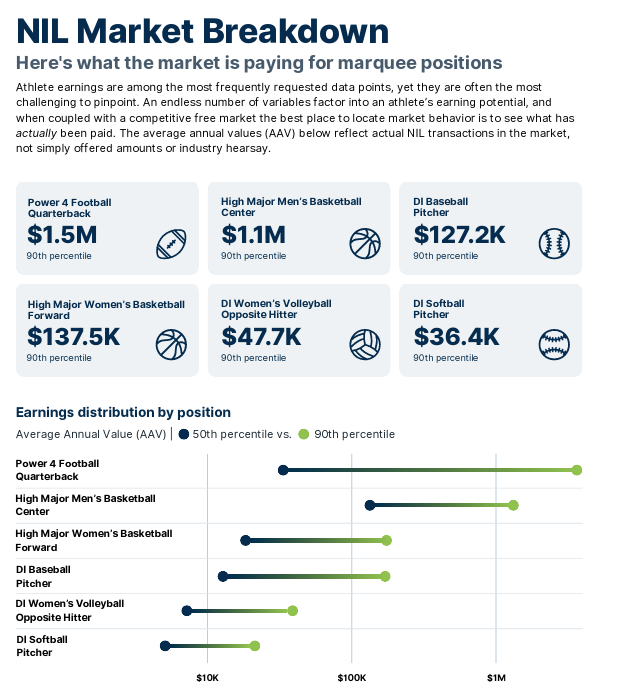
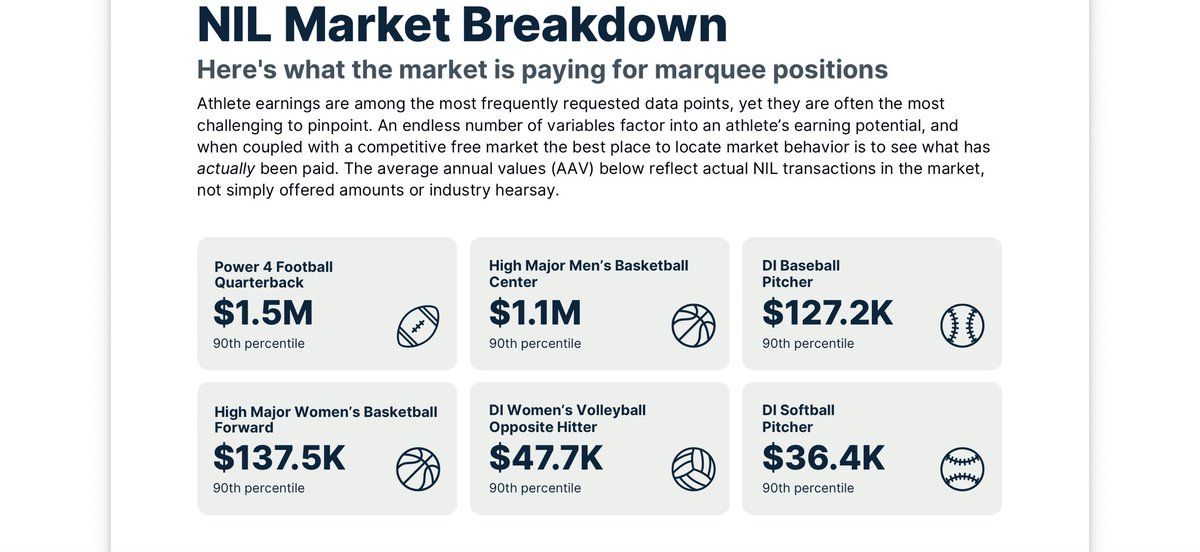
- Avg. P4 QB is making $1.5M, high-major MBB center is making $1.1M
- Men's tennis led Olympic sports in earnings per deal last year ($2.7K)
Opendorse is projecting college athlete compensation - rev-share + third party pay - to exceed $4 billion this coming year, per its annual NIL Report.
A Big Ten school’s annual average spend exceeds all others at $48M, followed by the SEC ($44M), ACC ($28M) and Big 12 ($24M).