The older you get and the more you mature, the more you'll realize that the circle of people around you will continue to grow smaller, and in the end, the only ones who truly matter are your family and your real friends.
Many people will enter your life and leave almost as quickly as they arrived.
Others, the ones you were convinced would be there forever, will eventually disappoint you.
Some promises will be broken, some bonds you thought were unshakable will quietly fade away and some people you trusted with your whole heart will become strangers you barely recognize.
At first, this reality can feel painful.
We grow up believing that the people we love today will always be part of our tomorrow.
We assume that loyalty is permanent, that shared memories guarantee a lasting connection, and that time spent together creates an unbreakable bond.
But life has a different way of teaching us.
As the years pass, you begin to understand that relationships are not defined by how long someone has known you, but by how they choose to show up when life becomes difficult.
You learn that some people love the version of you that benefits them, but disappear when you begin to grow.
Some enjoy your company when everything is going well, but vanish when challenges arise.
Others remain close only as long as your paths align, and once life pulls you in different directions, the connection slowly dissolves.
And while those realizations can hurt, they also bring clarity.
Because maturity isn't about becoming cynical or losing faith in people, it's about seeing relationships for what they truly are.
It's about understanding that not everyone is meant to stay forever.
Some people are chapters, a few are the entire story.
The older you get, the less interested you become in maintaining large circles and superficial connections.
You stop chasing approval. You stop trying to convince people to value you. You stop forcing relationships that require you to constantly prove your worth.
Instead, you begin to appreciate the rare people who stay.
The friend who calls when everyone else is silent.
The family member who stands beside you when life falls apart.
The people who celebrate your success without envy and support you through failure without judgment.
The ones who know your flaws, your fears, your weaknesses, and still choose to remain.
Those relationships become priceless.
Because eventually you realize that life It's about recognizing who is genuine.
And the truth is that as your circle gets smaller, your peace often grows larger.
You spend less time dealing with drama, expectations, competition, and disappointment. You invest your energy in people who reciprocate it. You learn that quality will always outweigh quantity.
Choose wisely.
Traders don't need to make calls. Fortune tellers do. A trader simply executes his edge, knowing that one trade is meaningless and that time eventually exposes who was trading and who was performing.
----------------------------------------------------------
| EDUCATIONAL CONTENT #1 | Wyckoff Schematic |
----------------------------------------------------------
Most traders don’t lose because their analysis is bad.
They lose because they don’t understand what price is actually engineered to do.
Retail calls it a breakout.
Market makers call it inventory distribution.
This is where most traders misunderstand the market.
They believe price moves because of patterns, trendlines, indicators, or “bullish momentum”.
But price is not random.
Price is delivered to areas where liquidity exists.
And in this example, the entire range acts as a controlled environment to create, attract, and absorb liquidity.
This is a Wyckoff Distribution Schematic Model 2 on NQ through the lens of market engineering.
After the bullish expansion, retail sees consolidation.
They assume the market is building strength for the next leg higher.
But during distribution, the market needs one thing above everything else:
Buyers.
Large inventory cannot be offloaded efficiently into weakness.
- It needs demand.
- It needs emotion.
- It needs traders to believe higher prices are coming.
That is why the range is built.
---------------------------------
1st - PSY – Preliminary Supply
---------------------------------
The first sign that supply enters the auction.
Price still looks bullish on the surface, but momentum starts losing efficiency.
From the outside, it looks like normal hesitation.
From a market-engineering perspective, supply is quietly being introduced.
----------------------------
2nd - BC – Buying Climax
----------------------------
This is where the public gets excited.
The move looks strong.
The candles look clean.
The narrative becomes bullish.
Perfect conditions for distribution.
Because aggressive buyers provide the liquidity needed to sell into.
A Buying Climax is not just strength.
It is often the first major transfer of risk from informed participants to late buyers.
--------------------------------------
3rd - AR + ST – Building the Range
--------------------------------------
After the climax, price reacts lower and retests the upper area of the range.
This creates structure:
Highs.
Lows.
Support.
Resistance.
Retail traders need these levels to make decisions.
Market makers need these levels because orders accumulate around them.
Stops above highs.
Stops below lows.
Breakout orders above resistance.
Dip buyers at support.
The range is not noise.
It is the liquidity map.
-----------------------------------------------------
4th - UT-B – The Manipulation Above the Range
-----------------------------------------------------
Now comes the key event.
Price trades above the range high.
Retail sees confirmation.
Breakout buyers enter.
Early shorts get stopped out.
Momentum traders chase.
Exactly the liquidity needed.
That move above the high is not necessarily designed to continue.
It is designed to access liquidity.
The breakout creates the illusion of strength while distribution is being completed into the buying pressure.
This is engineered liquidity.
Aggressive Re-entry Into the Range
The real signal is not the move above the high.
The real signal is the failure to stay there.
Once price rejects and cuts back into the range, the story changes completely.
If the breakout were real, price should accept above the range.
If price immediately returns inside, it means the liquidity above the high was used — not respected.
That is the trap.
-------------------------------------
5th - LPSY – Last Point of Supply
-------------------------------------
After the failed breakout, price gives one more weak attempt higher.
This is where late buyers still believe they are getting a second chance.
But structurally, this is often the final opportunity to sell into remaining demand.
The market is no longer showing expansion.
It is finishing the transfer.
----------------------------------
6th - SOW – Sign of Weakness
----------------------------------
Then support breaks.
This is where market character changes.
Breakout buyers are trapped.
Dip buyers defend the wrong levels.
Old support becomes resistance.
Once price retests from below and fails, distribution becomes confirmed.
The market has no reason to stay inside the range anymore.
The liquidity has already been engineered.
---------------------------
7th - Phase D → Phase E
---------------------------
Now the markdown begins.
To retail, it looks like a sudden dump.
But it was prepared long before.
The highs were swept.
Breakout buyers were trapped.
Shorts were stopped.
Demand was absorbed.
Support failed.
The move down is only the result of everything that was engineered inside the range.
----------------------
The biggest lesson:
----------------------
A breakout is not bullish just because it breaks resistance.
A breakout is only bullish if price accepts above resistance.
If price sweeps the highs, rejects aggressively, breaks internal support, and turns old support into resistance, it is not strength.
It is distribution.
Retail sees price.
Market makers see liquidity.
Retail trades the illusion.
Market makers engineer the illusion.
Same chart.
Completely different understanding.
Liquidity first.
Acceptance second.
Direction last.
🉐 Announcement: Product Enrolling (+limited offer) 🉐
As you know, we’re just 3 weeks away from the release of our proprietary app and I want to showcase all the features and future plans we have in mind.
This wi be massive and game changer for many. (read till the end)
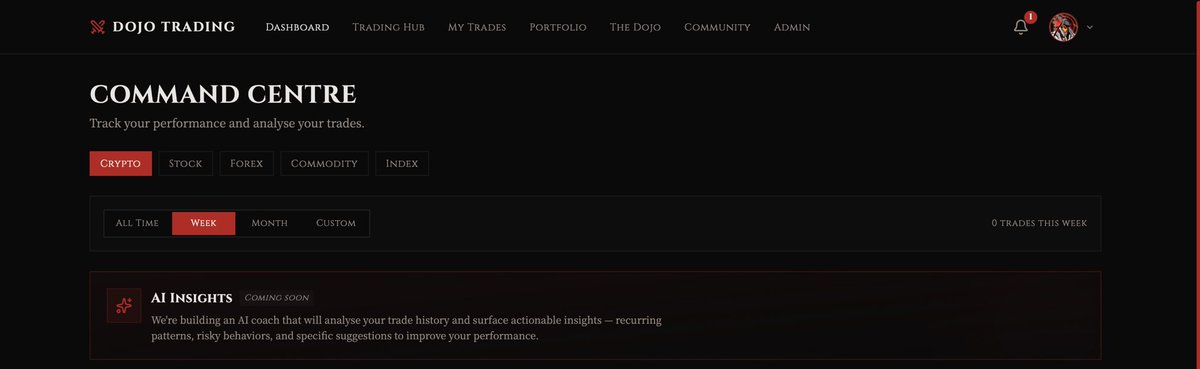
🉐 Dashboard
In here you’ll be able to monitor your active and passive portfolios, manage futures, spot, stocks, commodities, and crypto from one professional workspace.
🉐 Trading Hub
Probably one of the most interesting features.
Members will be able to plan their setups (see here -> https://t.co/7konHfsmce)
and share them in the hub, if they want.
In this way, people will interact with each others about trading setups creating a collaborative environment.
🉐 MyTrades(aveanced trade management)
As shown in the video, members will be able to organize setups by strategy, risk management, and key trading parameters to track and improve performance.
🉐 Sensei AI
We will also integrate the Sensei AI that will analyze your trades to identify strengths, weaknesses, recurring mistakes, so you will grow step by step.
🉐 Smart Portfolio
Members will be able to track assets and receive Sensei AI-driven insights on risk exposure, diversification, and portfolio optimization.
🉐 The Dojo (Next-Gen Education)
How many PDF pages does Notion have?
More than 2.000, an educational trading book, but it’s time to level up.
It will be a fully redesigned educational experience integrating all learning materials into one modern platform and the goal is to integrate guided learning paths, simulations, quizzes, and progress tracking tailored to every trader level.
🉐 Future plans:
1️⃣ Integrate AI market scanner to discover real-time trading opportunities based on your trading style and preferred strategies.
2️⃣ Integrated live sessions
The final goal is to detach from Discord and being able to follow the live sessions directly inside the platform.
3️⃣ Custom Workspace
Personalize your environment with modular dashboards, watchlists, and custom layouts.
4️⃣ Integrated Economic Calendar + seasonality
Over time, I want to give access to a built-in macroeconomic calendar with AI-enhanced market context and filtering tools + seasonality charts for trading specific commodities.
5️⃣ Ranking & Reputation System
Why not building credibility within the community through quality analysis, setups, and contributions? Why not give them rewards for this? This is something I also have in mind.
6️⃣ Multi-Broker & Multi-Exchange Sync
And what if we can allow people to connect brokers and exchanges to automatically sync portfolios, trades, and performance?
Another thing I have in mind.
As you can see, the goal is to build more than a trading platform, but a complete ecosystem combining education, trading, technology, and collaboration.
This is my long-term plan.
⚡❗Limited offer⚡❗
At the moment, the price continues to remain $9.99, but considering all the work done during these 3 years and this integration, it will increase to $20.00/month starting from the 10th of June.
You got time to lock in your sub lifetime at the original price till that date.
Don't sleep on it, quality already speaks and will speak louder in the coming months.
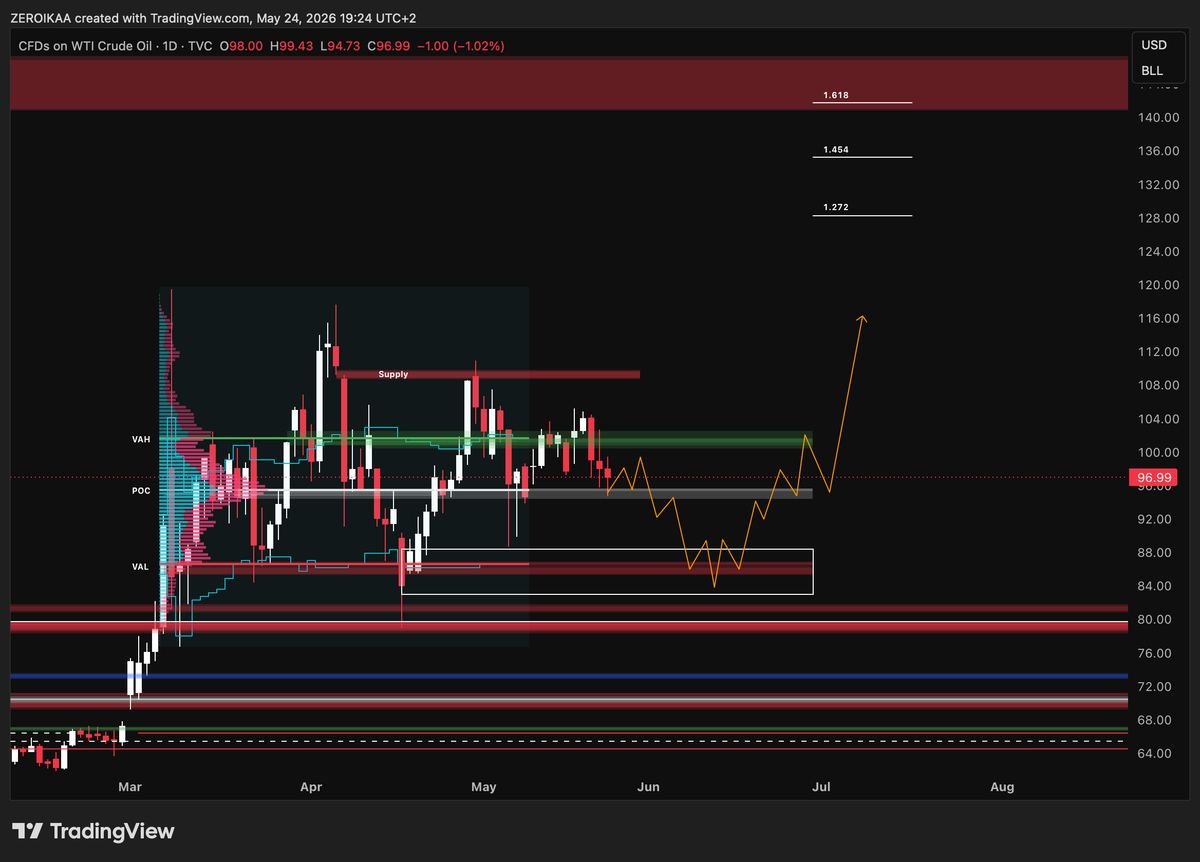
$USOIL
In my opinion, we need to pay close attention to US OIL, and this is the plan I have in mind.
After the pump in December, many tried to suggest that the move could be completely retraced, but the truth is that US OIL keeps building value, and we have been inside this fair value for more than 70 days now.
As you can see, we continue to migrate between the value area low and the value area high with small deviations, but in my humble opinion this is happening within a reaccumulation structure as value is being confirmed.
The current bullish bias is also supported by the non-commercials which are skewed to the long side, making perfect sense to the current thesis.
For this reason, with the current migration of value away from the VAH, it is likely that in the coming weeks we could see a return toward the VAL around $86/$82, which is my area of interest, and then potentially move, as TP1, back toward the POC and the VAH.
However, since I believe this fair value structure is reaccumulative in nature,I think it could eventually break to the upside.
If we manage to break the previous highs, in my view it could potentially even reach $128 or $140.
As you can see, I have the extensions marked there, and this is the setup I’m currently monitoring.
Keeping it simple, from value2value.
💆♂️
You don’t win by forcing it.
You win by becoming calm enough to see clearly and disciplined enough to keep showing up.
Confidence is not built by affirmations.
It is built by stacking undeniable proof.
Day after day.
Trade after trade.
Rep after rep.
Become one with the proces.
📑Main COT rules I use for helping myself to position alongside institutions: (+ example)
- Commercials are usually early, non-commercials are usually late (but they're the ones putting fuel into the reservoir)
- I trust extremes, not small weekly changes (always looking at net)
- The bigger the timeframe, the more important the positioning
- Crowded positioning increases reversal probability but strong trends can stay crowded longer than expected (fragile environment developing -> timing is essential or looking for extra triggers to determine short/sell)
- COT works best with intermarket analysis
- I care more about the positioning rather than the headlines
- Net positioning matters less without historical context
- Multi-year percentiles are more important than raw contracts
- Large non-commercials drive momentum phases and trend extensions
- Divergences between price and positioning are high-value signals
If price rises while non commercials reduce longs:
👁️underlying demand may be stronger than visible momentum (+1 to remain positioned)
If price rises while commercials aggressively sell:
👁️late-stage trend / distribution risk increases
--------------------------------------------------------
- Positioning alignment across commodities, bonds, equities and FX matters more than isolated signals
- USD positioning heavily influences global liquidity conditions
- Energy + copper + semiconductors together provide strong growth signals
--------------------------------------------------------
I never use COT as a standalone timing tool (otherwise you risk of getting rekt)
COT is best for:
- regime identification
- macro bias
- swing positioning
- cycle analysis
- capital rotation
The best setups tend to appear when you have:
extreme positioning + intermarket alignment + sentiment that remains one-sided
You always need to pair the "bias" formed with the COT with your entry/exit strategy.
--------------------------------------------------------
This is an example I had brought up on Wheat back in December, where we had a clear accumulation pattern, and toward the end of December I was also looking at the COT.
As you can see, the non-commercials were heavily positioned short, with an actual increase in short positions, which indicated a very, very negative sentiment but on the other side, the commercials were increasing their positions, and that’s because they clearly understand the direction of the wheat market, since it’s their daily bread, so to speak.
So we had a balance that was heavily skewed long for the commercials and short for the non-commercials, who were literally squeezed to the upside.
Result: strong long bias.
$NKE
There’s a lot of attention around Nike right now so I would like to give you mi view on it.
The stock has collapsed (down roughly 77% from the November 2021 highs) and it’s currently trading in a pure bearish price action environment, where every retracement has been sold aggressively.
At the same time, there are a lot of bearish headlines surrounding the stock.
Some people are even starting to question whether the company itself could completely fail.
There’s a lot of fear in the market right now and this isn’t only due to the stock price action itself, but also because of certain decisions the company has made that investors clearly did not appreciate.
In my opinion, this is a moment where it’s important to stay rational.
👉From a technical perspective, as you can see, the developing value are, the blue line, together with the VAH around the $73/75 zone, created a strong bearish impulse that completely destroyed the structure that originally fueled the 2015 and 2017 expansions.
However, Nike is now approaching zones that I personally find extremely interesting.
The first one is this multi-month structure formed between 2013 and 2014.
Now, trying to knife-catch Nike here, in my opinion, makes absolutely no sense. Just because you see a monthly demand zone doesn’t mean you should immediately buy.
Personally, I would like to see price action start consolidating inside this zone and begin creating value.
If that happens, then you could potentially start considering an entry based on a trend reversal idea:
range formation, breakout, retest and then expansion.
And that applies not only for leveraged trading, but also for spot positioning.
If this multi-month demand zone were to break, and obviously we don’t know yet, it has to be monitored step by step, then I would start evaluating the next major area of interest around $20.
That, to me, would represent a truly massive opportunity.
Because as you can see, there is a huge volume cluster there with the POC, all generated between roughly 2009 and 2012, meaning a very historical area of acceptance.
If price were to revisit that region, the market would essentially rebalance the entire zone from an AMT perspective, and that’s where I would seriously consider a long-term spot entry.
🤏So basically, we have two scenarios:
- Consolidation inside the current multi-month demand zone.
- Or a move toward the $20 area
Still, I think Nike is worth watching closely at current levels.
As for upside targets, I don’t think it’s unrealistic, but definitely from a very long-term perspective, to see price eventually revisit the EQ around $94, and potentially even the $138–140 area.
But again, this is a very long-term view.
I personally do not believe Nike is going to die miserably.
It’s still a very strong brand, and these kinds of cyclical phases happen even to companies of this caliber.
So definitely keep an eye on it.
Real Estate Capital Rotation
If your money is tied to residential property, you’ll probably want to check out the next newsletter
At the very least, there are opportunities to hedge your wealth…