#BTC
Not too strong of a reaction at the moment
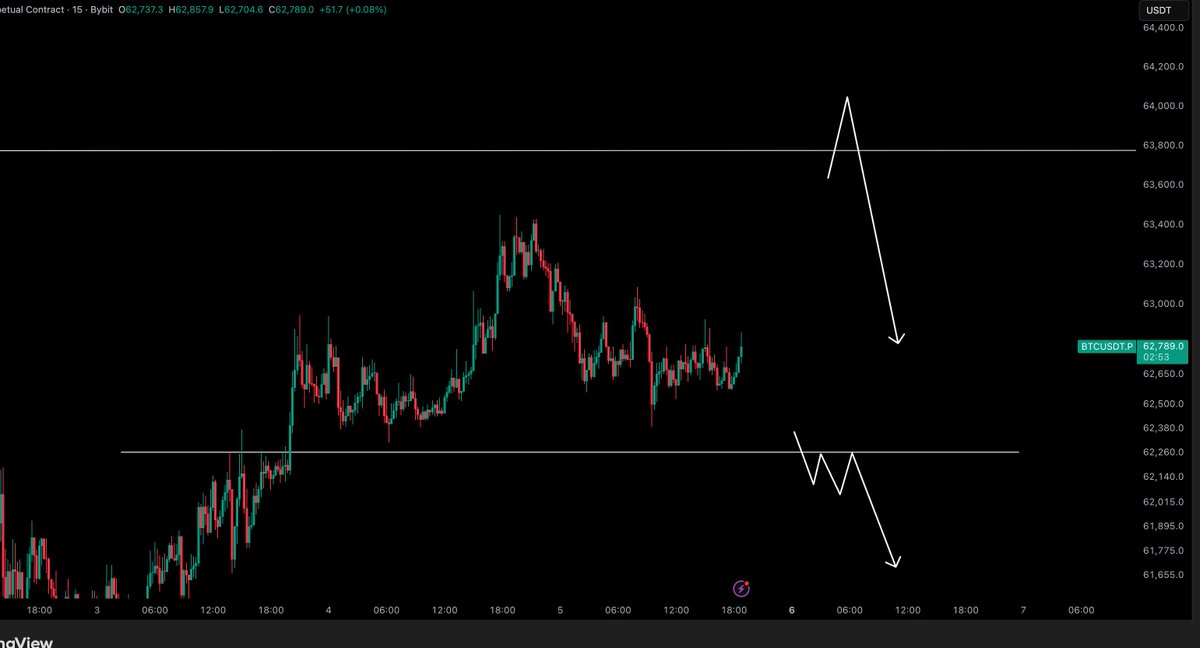
As long as the orange support here produces weaker rallies, price will keep forming Lower Highs to produce an eventual breakdown deeper into the $58000-$66000 Range (blue-blue)
$BTC #Crypto#Bitcoin
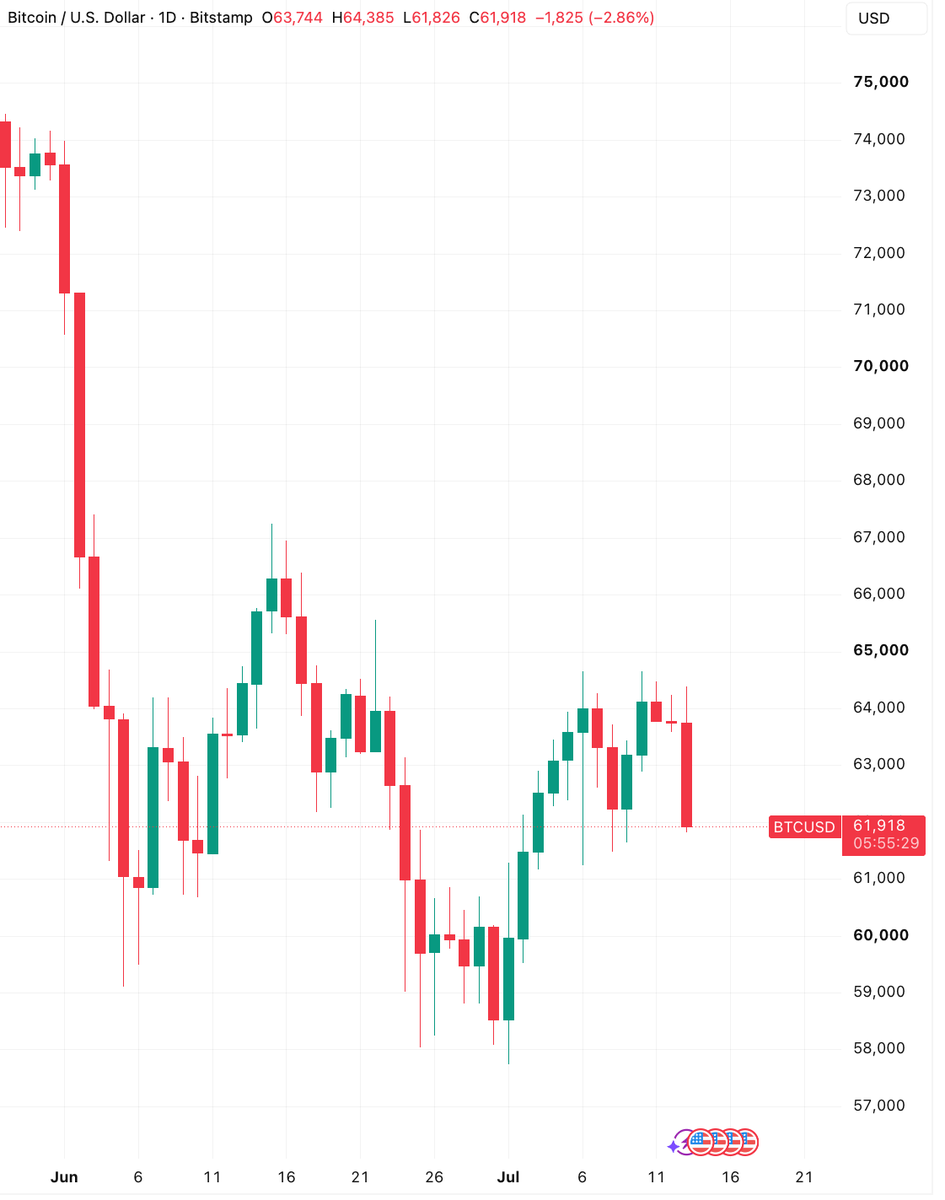
Bitcoin has now fully lost the $63,000 level.
Buyers still haven't managed to reclaim what was one of the most important support levels on the chart.
That's the first warning sign.
If we stay below $63,000, I'm watching $61,000 next. That's the level where I'd expect buyers to put up a fight.
If that breaks, $59,000-$59,500 becomes the next major area of interest.
Bulls need to reclaim $63,000 quickly.
Right now, the chart isn't giving them much to work with.
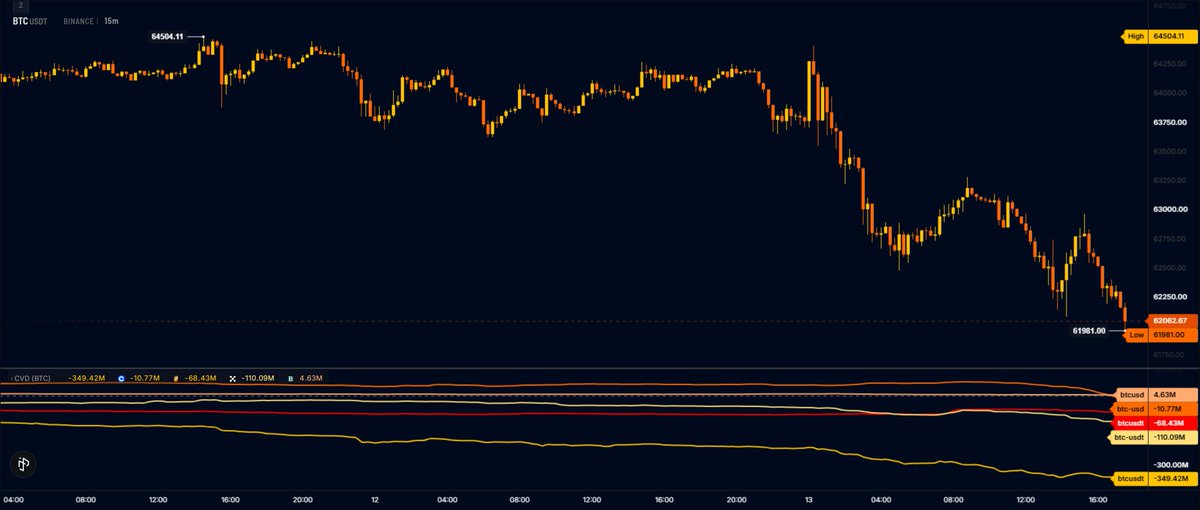
🚨JUST NOW: BITCOIN FALLS BELOW $62,000
Bitcoin erased its weekend gains, returning to levels seen three days ago.
More than $314.76 million in long positions were liquidated over the past 24 hours.
#BTC
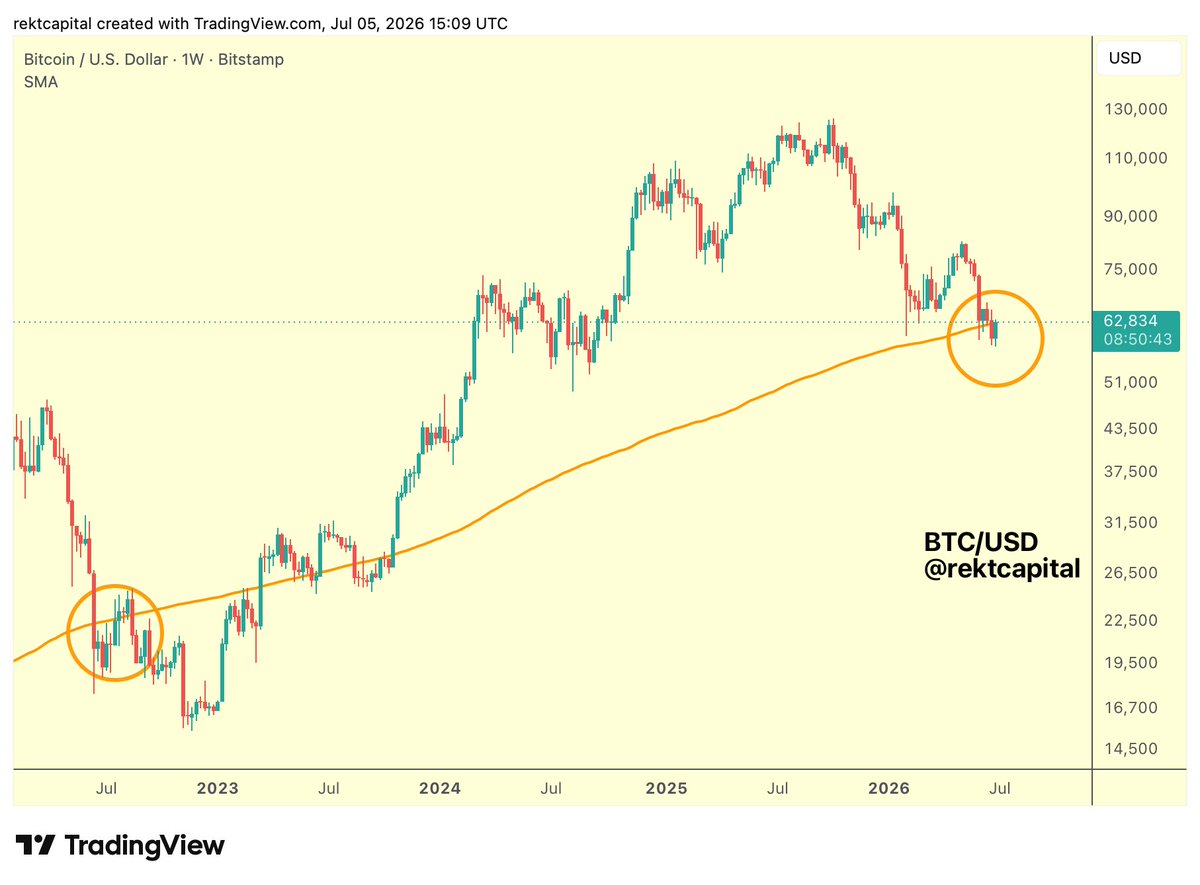
Bitcoin has deviated below the 200-week SMA, proving how unreliable a support this SMA can be
In saying that, it's important to also mention that the 200-week SMA can also act as an unreliable resistance in the early phases of such a macro deviation
Bitcoin is therefore likely to continue experiencing relief throughout July and so a brief reclaim of the 200-week SMA wouldn't be out of the ordinary to enable that limited relief-focused upside
After that and over time however, Bitcoin would once again breakdown from the 200-week SMA to perform a deeper macro deviation below it to search of the final Bear Market bottom
$BTC #Bitcoin
🚨GOLD FLASH CRASHED BELOW $4,090 ON HYPERLIQUID THIS WEEK
Gold dropped about $100 on Hyperliquid’s XAU perpetual contract on July 4, with the move playing out in roughly one minute.
Arbitrage bots and market makers quickly closed the gap, snapping the price back.
In May, its SPACEX-USDH pre-IPO perp crashed 45% after an oracle mishandled stock split data, liquidating $1.51 MILLION across 1,393 positions.
The past year, about ~50% of the top 50 coins have outperformed $BTC.
This is actually one of the highest levels we've seen since the 2021 top.
I think this is due to a lot of coins having had a very bad final bull market year and generally selling off a ton already throughout 2024 & 2025.
This has caused many of these to pretty much trade sideways against $BTC for some time now, which is why this has trended up.
Ethereum Treasury companies continue to go down.
But BitMine is something to keep an eye on.
It has been included in Russell 2000, so some new buying demand could emerge.
And in that case, it could help the $ETH price.
🚨SWAN BITCOIN CEO KEEPS CUTTING HIS OWN BULL CASE AS BTC DROPS
Klippsten now sees just a 10-15% chance of Bitcoin hitting a new all-time high in 2026, his lowest estimate yet.
He gave BTC over 50% odds in December when it was near $90,000, then cut to 25% in May as it fell to $73,000.
Bitcoin is now at $60,000, down over 50% from its October 2025 peak of $125,000.
🤯 BITCOIN MAY BE PLAYING OUT THE MOST FAMOUS BOTTOM PATTERN IN TRADING.
It is called Wyckoff accumulation.
The way smart money builds a position before a markup.
And Bitcoin is tracking it almost step for step.
The selling climax. Done.
The secondary test. Done.
Next comes the spring.
The final flush below support that traps the last sellers.
Then the markup begins.
If this schematic holds, the scariest drop is the setup.
The bottom is built where everyone gives up.
🚨GRAYSCALE STAKES $115 MILLION IN HYPE
Grayscale’s $HYPG staked 1.77 MILLION HYPE worth $115 MILLION in the past hour.
The position was seeded yesterday by Hyper Holdings Global.
$BTC The 2-Year Moving Average Multiplier has been flashing a long term buy signal for the past 4 months.
Historically, buying when price traded below its 2 year moving average has yielded good returns in the long run.
But, good to note that this level is often far from the actual bottom and can take many months to actually play out.
Another one of those high timeframe indicators/metrics that tend to work and have worked in previous cycles, but are never a guaranteed way to catch a bottom. Just a guideline.
🚨 $BTC IS ONE STEP AWAY FROM A MASSIVE CRASH...
After sharp drop to $59k, market has entered a prolonged distribution phase...
Based on similar sell-offs, this range could persist for another ~15-30 days between $61k & $69k
Based on chart below, here's my roadmap for next 2-3 months:
1. Ascending channel grind → local top at $68k-$69k
2. Brief consolidation + 5%+ drop
3. Acceptance below $59k
4. Drop toward $48k + early bottoming phase
5. Cycle bottom ~$42k
One thing is clear - don't expect a true market reversal anytime soon
For now, downside remains the path of least resistance
I'm one who publicly called 2025 $BTC ATH, move from $126k → $60k and drop from $83k → $59k...
If you missed earlier ones, no stress - more calls are still coming
Turn on notifs - you won't want to miss next call