TA | Charts | Patterns | Handmade Quality Quilts | Old Ladies | Naptime | Warm Glasses Of Shut The Hell Up | Memes | 1000% Financial Advice | VERY Retarded
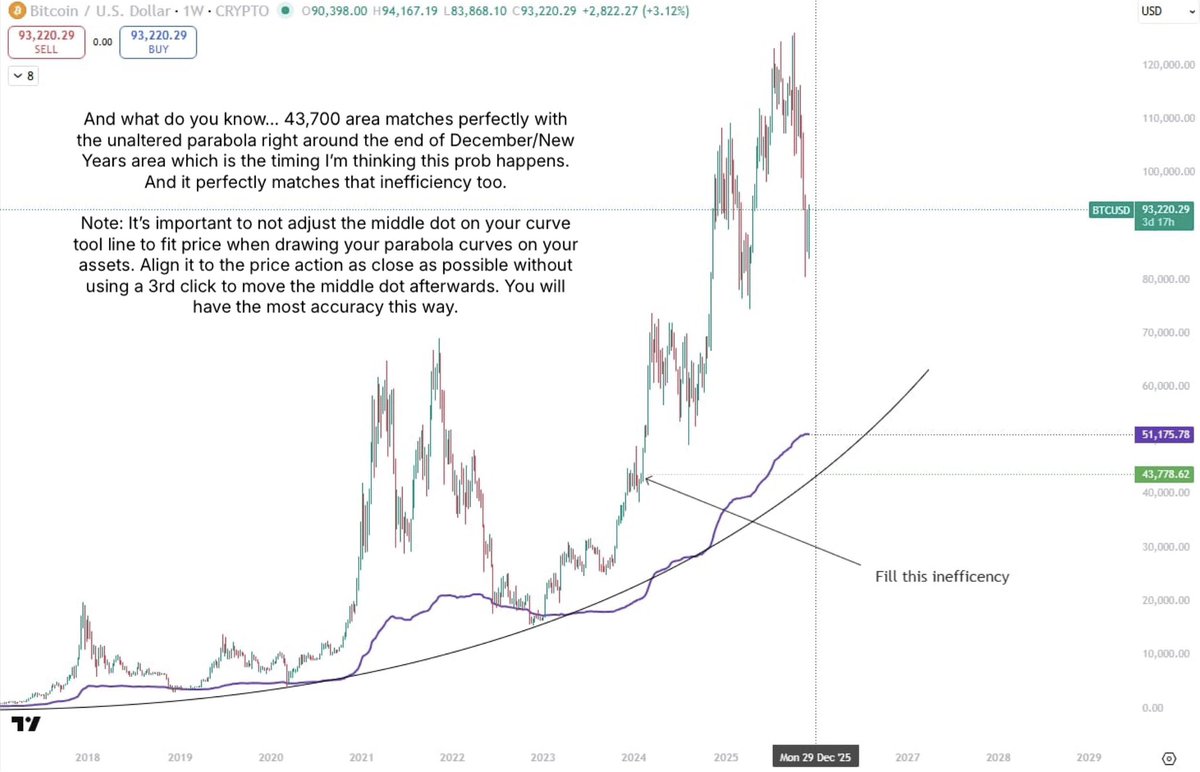
Alright. I think I have a pretty damn good idea now where $btc is going to bottom. I had to bust out an old indicator that has had my attention for the last few years that I had completely forgotten about.
It’s called “Coin Value Days Destroyed”
Type CVDD into indicators on tradingview and it should come up.
Just focus on the very first 2 charts you see here in the first image below to see the significance. It’s the purple line. We always come back and perfectly retest this specialized MA on the “Daily Line” chart before the bull run starts. 👇
(Note: I used the 2D chart below so the whole chart would fit for the screenshot. The metics and visual is pretty much the same as 1D so it’s fine)
#Btc #Bitcoin $Eth #Eth
Yeah the clarity act news from two days ago of it being pushed until after the 5 week recess that starts this Monday is almost certainly true. It doesn’t change what the chart is showing still tho which is what I based my analysis on. Plan is still the same. The move up is just not happening as fast. It’s already starting tho. Patience.
$Btc
The arched over rejections from the old ranges VAL, the Oscillators, the massive liquidity clusters below that are intentionally being untouched bc it will cause too big of cascade but most people don’t understand that, price stalling and sudden reclaims minutes before key closes, too many things to list.
This what I think happens from here. Whether the clarity act is a part of it or not. For a cleaner non-narrative example, look in the retweet of this retweet 👇
@Shahryar_trades Maybe I spoke too soon. That might be it and we’re heading up now. I just realized it just finished another smaller M top right after a larger one. This has been the theme for every correction’s ending ever since the 62k bottom. $Btc
@Healingsoul9876 Curtesy post for you. Pretty sure that was your entry brother. If you're still waiting, I think now is likely the time! See this thread I’m retweeting from
Crypto charts are wild and quite intersting right now. If you’re confused I have a feeling you will get some clarity this weekend. But it won’t last long once it arrives. So seize the opportunity. And plan accordingly.
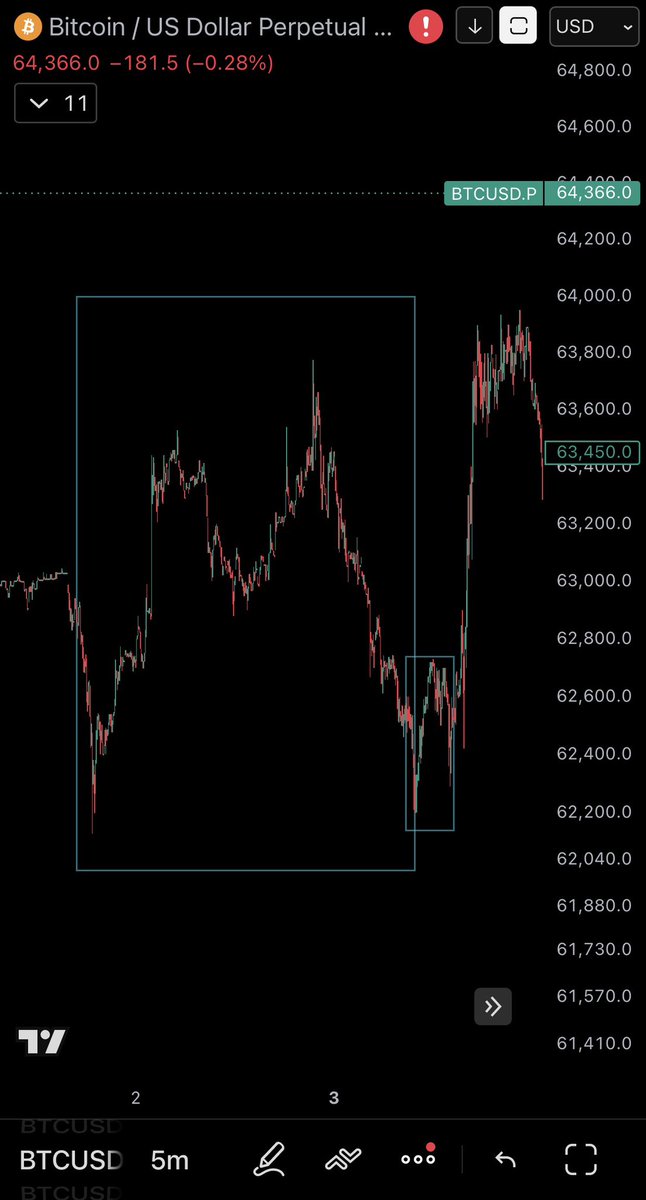
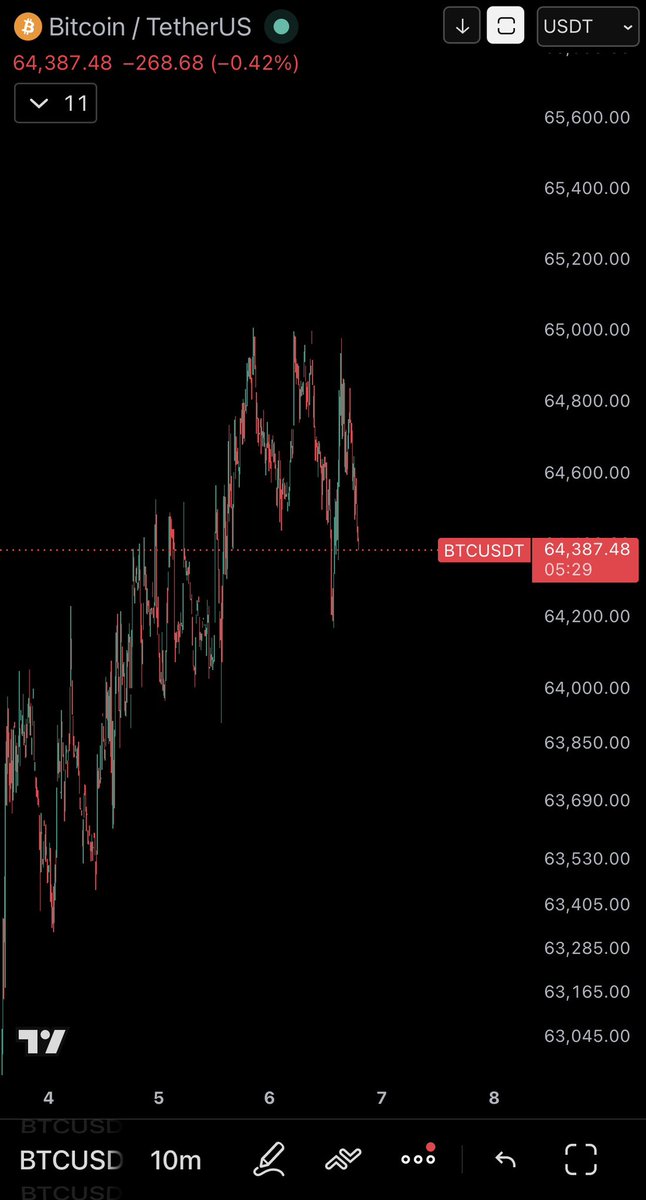
I’ve been bullish and saying over and over that we aren’t going to run the 61,750 low for weeks. Market is very bullish here rn. After the NYO reaction this morning I don’t think you’re going to get an entry near the area you were hoping for. Tomorrow is probably a good day to look for an entry as Thursdays are often bearish days and Thursdays are well known to be an opportune days for entires. Don’t get greedy. Bc careful of leverage. Don’t wait past tomorrow.
I’m targeting the $2300 area on $Eth and the 73,000 area for $Btc. I’m pretty sure this is going to happen fast. Don’t be fooled by the Clarity Act vote if it happens this weekend. It will likely pump
like crazy upon announcement and then the vote fails and we dump to mid to low 50ks from there and fast.
I have a feeling the NYO low this morning isn’t going to be ran but don’t hold me to that. I may be wrong. But sure feels that’s what’s about to happen.
@Shahryar_trades Oh were you talking about this? I think you just go the fill on this tho pending on which exchange you are on. Nice job as always mate
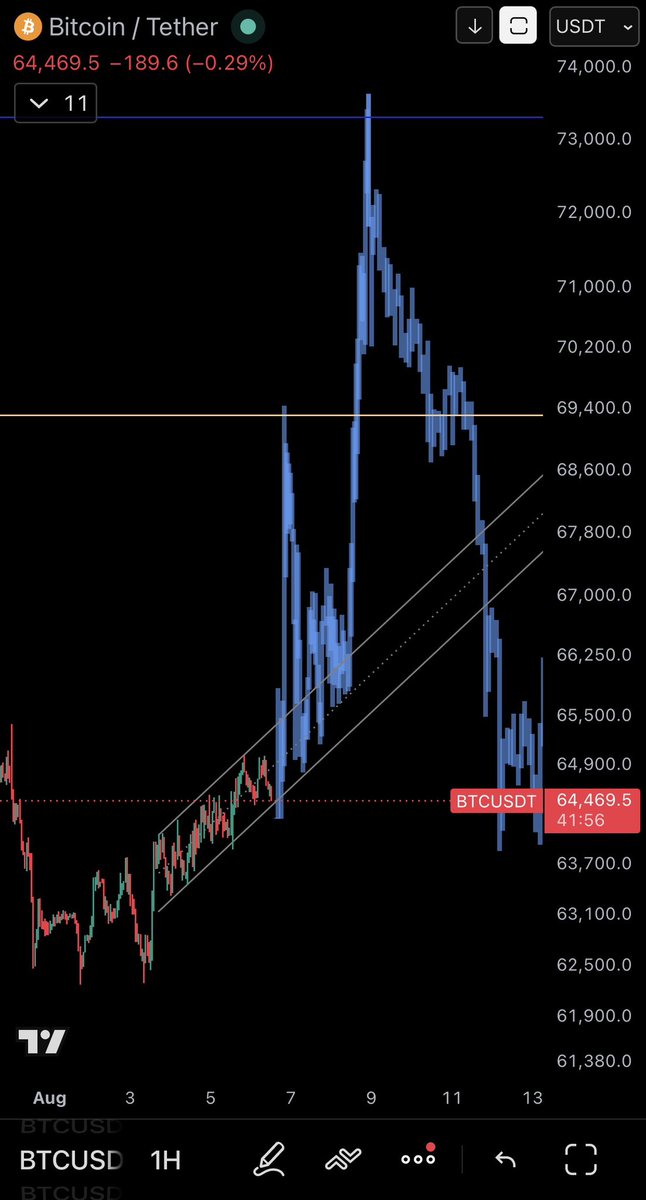
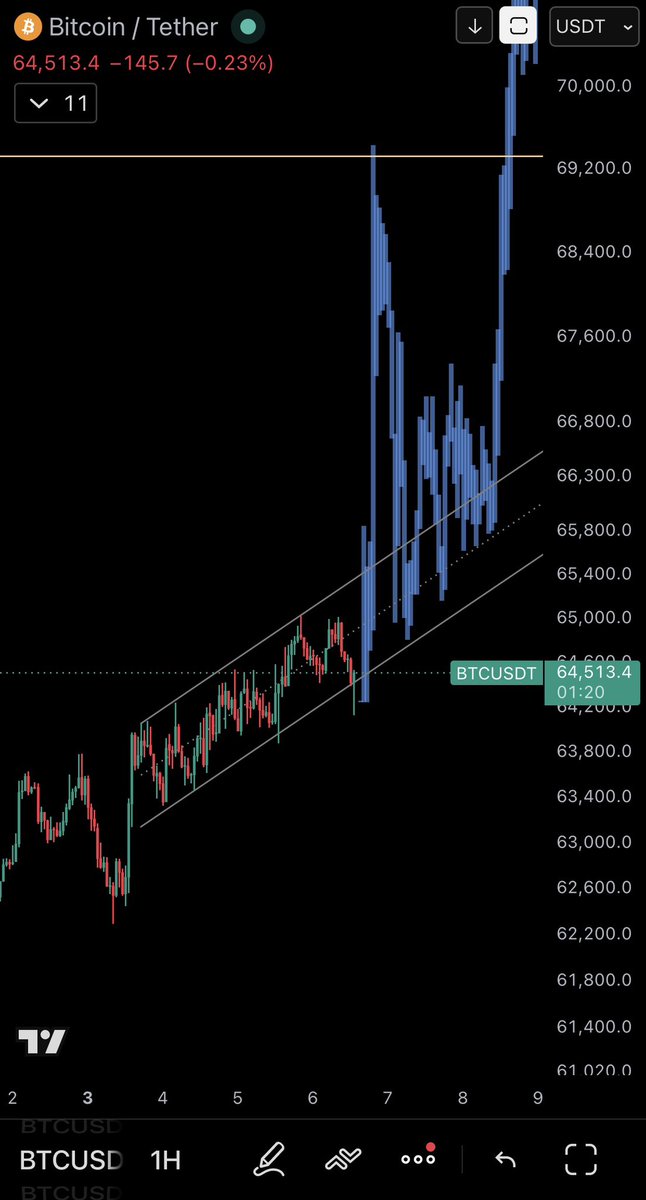
I just realized I drew the wrong trend line on the last image above. Needed to use the channel. I think it will likely do this. A fake break like the August 5th and we don’t take yesterday’s NYO low. The fractal lines up better this way too with the top being right on Sunday the 9th which is most likely imo if this Clarity Act situation is what is to unfold with all of this. $Btc
This is what I think happens. This is how I think we bottom. Last big drop you see here is black swan event that brings us somewhere between high 30ks to low 40ks.
$Btc $Xrp
@GuidoVerweyen Yes a sweep of .80 cents when $Btc is hitting the 54k area. Then up to $2 - $2.30 area, and then mega nuke. You prob already saw this but the last chart here is $Xrp
This is what I think happens. This is how I think we bottom. Last big drop you see here is black swan event that brings us somewhere between high 30ks to low 40ks.
$Btc $Xrp
I just realized I drew the wrong trend line on the last image above. Needed to use the channel. I think it will likely do this. A fake break like the August 5th and we don’t take yesterday’s NYO low. The fractal lines up better this way too with the top being right on Sunday the 9th which is most likely imo if this Clarity Act situation is what is to unfold with all of this. $Btc