Planes, trains, and automobiles! 🛩️ 🚂 🚗 🚲 🚉 🚀
Well, planes might be a bit extra, but how do you get to school in the morning? Find another class and see if you notice any differences in your pie charts.
https://t.co/3JiydyXK1l
#SASDataFly#DataLiteracy
Are your students looking to further their scratch knowledge? 🧠
With our Further Scratch path, they can make computer-generated art, music, games and simulations.
Get started: https://t.co/vyMTQmbcmS
#LearnToCode#GetKidsCoding#Scratch
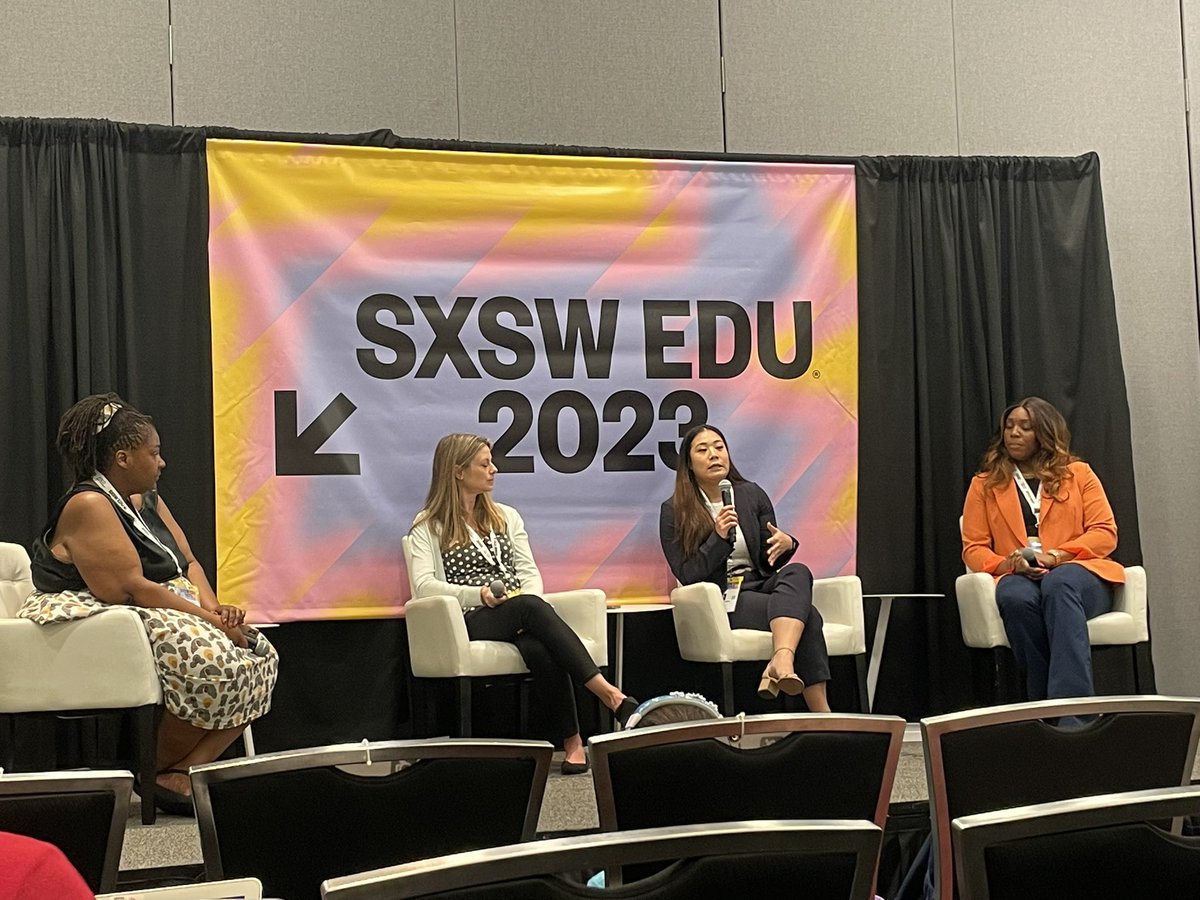
Woohoo, great panel of all women diving into how we support “Data Training in a Web 3.0 Future” at #SXSWedu@SASeducator@dsforeveryone
Appreciating the call outs for high quality progressional development!!
The Friday Institute's Hub for Innovation and Research in Statistics Education team created this Data Flight. They're launching a new free OPD platform for educators about using data and tools in classrooms. Register: https://t.co/XJOAe36IRh
https://t.co/PDDAXkZyCV
#SASDataFly
This #InternationalWomensDay, we celebrate the many achievements of women around the world. Today and every day, let's champion women's achievements, challenge bias and inequality, and promote inclusion and diversity. Together we can all #EmbraceEquity. 🌍
#IWD2023
Today’s the day friends! Join us at our #SXSWEDU session. Run 🏃, don’t walk and cultivate an understanding of building empathy through data!
https://t.co/W5PXDHIyRs
#DataLiteracy#STEAM
We love seeing and meeting new friends! If you are attending @SXSWedu, join us for session on building empathy through data! https://t.co/m1KkXHnSql
#SXSWEDU#DataLiteracy
The role of AI in education can bring feelings of apprehension, but embracing technological advancements prepares students for the future. https://t.co/MkLHeSB3MV
#ChatGPT#edtech
One school’s code club with the goal “to break boundaries including stereotypes, the gender gap in technology, and socioeconomic status.”
https://t.co/iP9d0tjdKl
#coding#computerscience
Are there vegetable people and fruit people? Do healthy eating habits correlate? Let's find out with this scatterplot. Track your fruit and veggie consumption for a day or a week and plot the relationship between the two. 🍉 🍇 🍋 🥕 🥦 🥬
https://t.co/swrzZRMnlr
#SASDataFly