Asia leverage has cracked before.
When KOSPI fell hard and quickly recovered most of the loss, it was higher 1 week later 93% of the time.
The failed cases were 1997, 2000, and 2008.
Stock market leverage in Asia is beginning to crack:
Stock trade defaults reported by securities firms in Taiwan rose to $62 million so far in June, the highest monthly total since data began in 2019.
A stock trade default occurs when investors who bought shares on margin fail to pay for those purchases, or when sellers fail to deliver the shares required to settle the trade.
Trade defaults have soared +300% over the last 2 months and now exceed the 2021 record by ~20%.
This comes as margin purchases have surged +160% over the last 12 months, to $19 billion, close to the all-time high set just before the 2000 Dot-Com crash.
By comparison, margin debt has risen +94% in South Korea over the same period compared to +50% in the final 12 months of the Dot-Com bubble.
Market leverage is out of control.
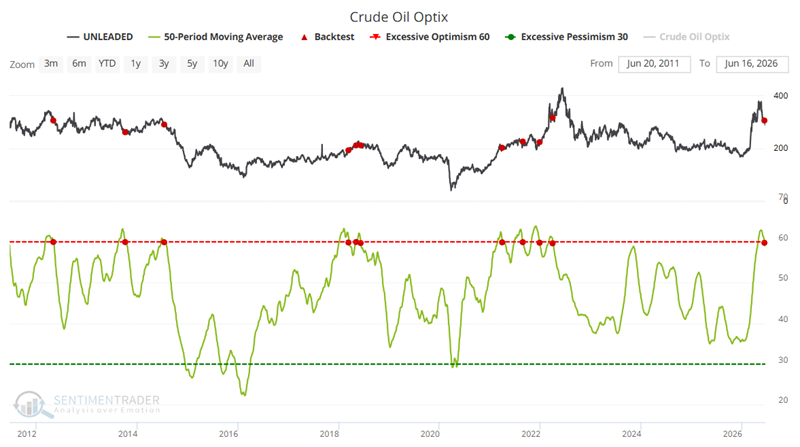
Crude Oil Optix crossed back below 60 for the first time in 21 days.
After prior signals, unleaded gas was lower one year later 80% of the time.
The seasonal tape is weak, but sentiment is the cleaner tell
See the full backtest: https://t.co/7ehF1VjHW9
High-Low Logic NYSE with Spike + a 252-day high filter.
19 prior S&P 500 signals. One-month win rate: 16%.
Breadth was already fragile; the next month has rarely been forgiving
See the full signal table: https://t.co/1zSd6AZsN9
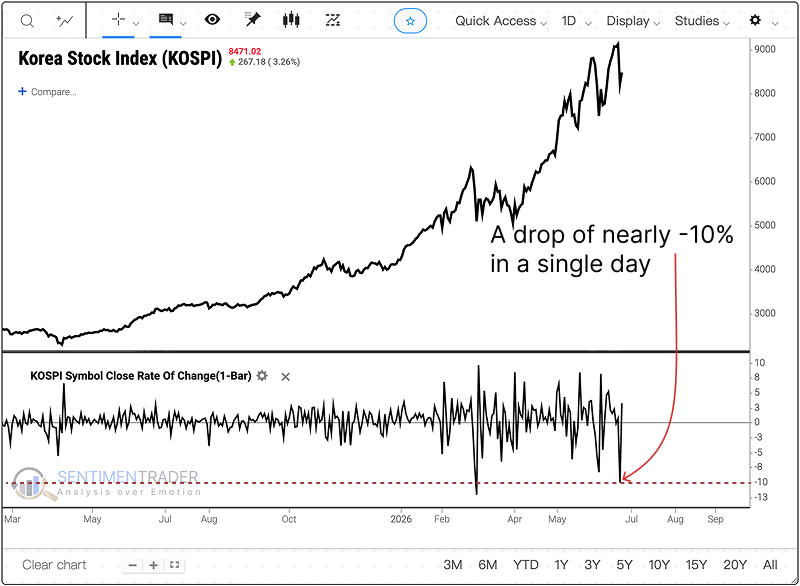
That was a thud.
KOSPI just fell nearly 10% in one session. It is only the 15th such drop in more than 40 years.
After similar drops during strong uptrends that were made back within 3 sessions, KOSPI was higher one week later 93% of the time.
Longer term, 1997, 2000, and 2008 still led to significant losses.
Read full analysis: https://t.co/IxEHDUAior
A separate breadth divergence signal just fired too.
Near 252-day highs, the S&P 500 was higher one month later only 16% of the time.
The siren has company.
Hindenburg Omen fired again earlier this week. Clusters of signals like this are common at major market tops. Does this always work? Of course not. But I've learned that when the tornado siren is going off, it's usually best to go to the basement... just in case. $SPX
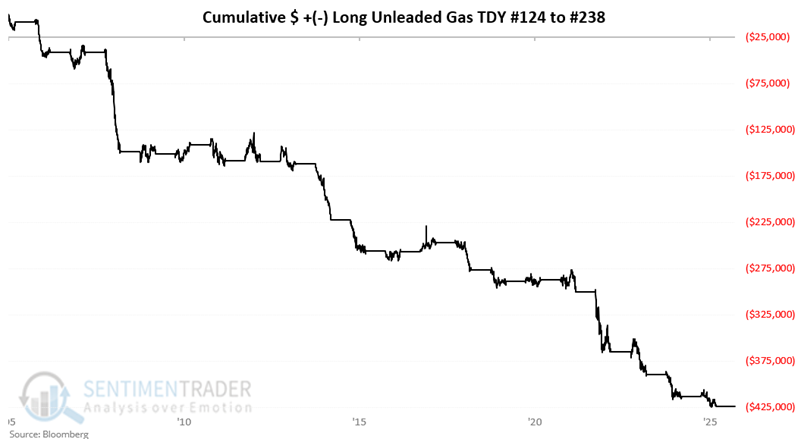
Gasoline futures have a seasonal problem.
Since 2007, long positions from trading day 124 through 238 gained in 3 years and lost in 18.
The win rate was 14%.
Moves of more than $10K skewed negative by 12 to 2.
Read full analysis: https://t.co/orFF5tZ9qj
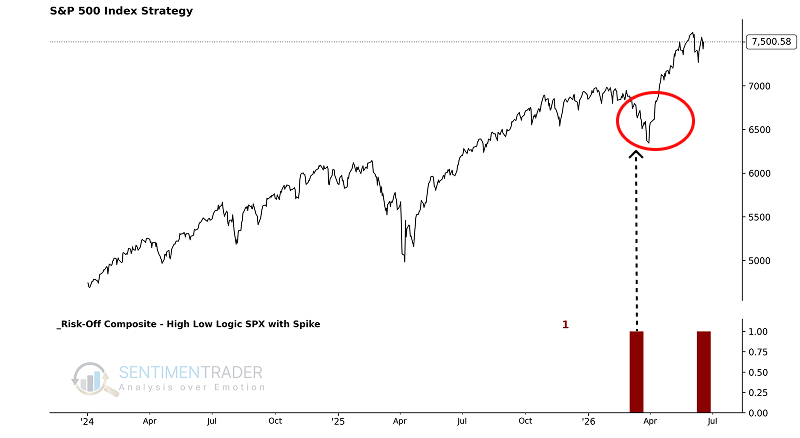
A lot of stocks are not joining the party.
The S&P 500 version of this signal flashed days ago. Now the NYSE version just triggered too.
When this happens within 21 days of a 252-day high, the S&P 500 was higher one month later only 16% of the time. Average return was a loss of 2.8%.
The last signal was February 2, 2026. The S&P 500 lost more than 7% over the following two months.
Read full analysis: https://t.co/TSJ9dMDt60
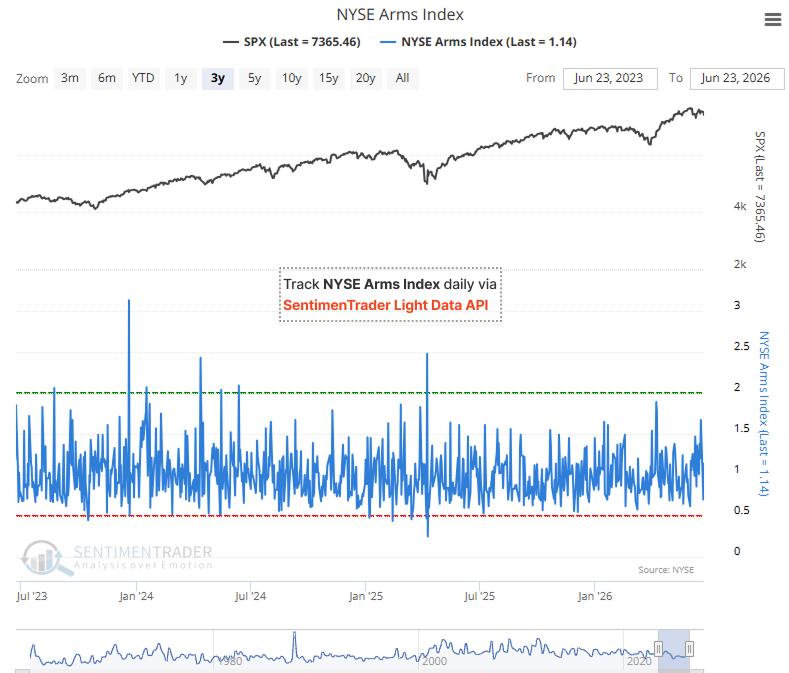
SPX is near 7365, but the NYSE Arms Index sits at 1.14.
Some selling pressure is evident, but this is not a panic reading.
For traders waiting for a fear-driven entry, the key signal would be a more pronounced spike in selling intensity.
Use the NYSE Arms Index to identify when selling pressure reaches capitulation levels. Available daily via the SentimenTrader Light Data API: https://t.co/xxRX5UyILt
The "Range Rank" refers to the relative position of a price within a recent price range. It first identifies the highest and lowest prices over the past N periods (including the current period), then expresses the current closing price as a percentage position within that range, yielding a value between 0 and 100.
A value of 0 means the close is at the period’s lowest point;
A value of 100 means the close is at the period’s highest point;
A value in between proportionally reflects the price’s strength or weakness within the range.
The formula is essentially:
Range Rank = (Current Close - Lowest Low) / (Highest High - Lowest Low) × 100
This metric is commonly used to gauge momentum, identify overbought or oversold conditions, and track where the price sits within its recent trading range.
The rails did not come along for the ride.
Industrials hit a 100% 3-year range rank while Transports slipped below the 85th percentile. The stricter Dow version was positive 56% of the time 12 months later, weaker than simple non-confirmations.
S&P 500-based versions show stronger median returns, but the worst cases land near major cyclical peaks.
Read full analysis: https://t.co/3LzvWtML7G
commentator on CNBC just said that they expect July to be a strong month...
you don'y say lol
it's only the strongest seasonal month... keep in mind as we have reviewed end Jun is notoriously weak
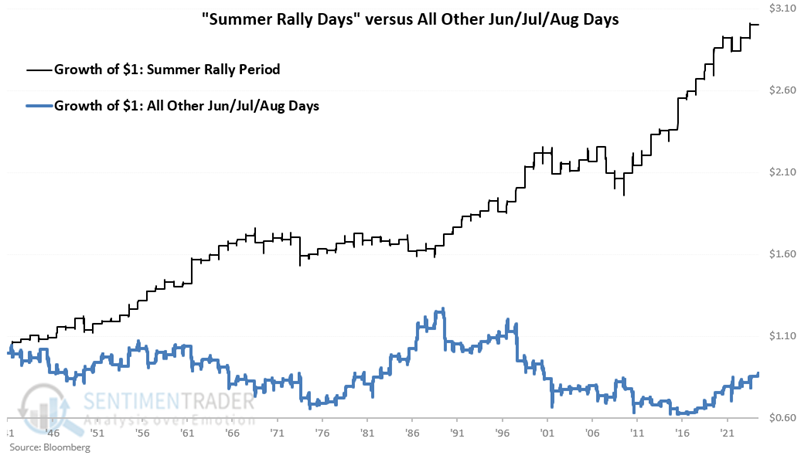
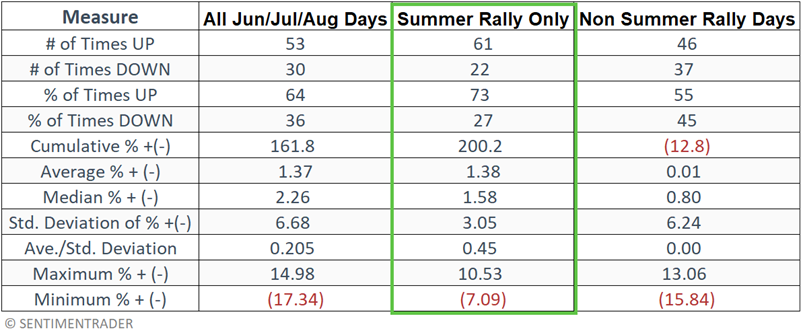
The "summer rally" is not exactly a summer thing.
It is the last 3 trading days of June and first 9 trading days of July. This year that runs from the June 25 close through the July 14 close. Since 1942 that window is up 61 times and down 22, for a cumulative gain of 200.2%. The rest of summer combined is down 12.8%.
2025 flipped it. The window was up 2.9% against 6.2% for everything else.
Still a hall of fame stat either way.
Read full analysis: https://t.co/n2Ek5M84bq
Risk-on at the surface.
Underneath, S&P 500 new lows are expanding enough to trigger a tactical risk-off signal. Prior signals saw below-average returns over the next 1-6 months.
Pure risk appetite inside the S&P 500.
SPHBI is the S&P 500 High Beta Index—the 100 stocks in the S&P 500 most sensitive to market moves (they rise and fall harder than the index). SPLVI is the S&P 500 Low Volatility Index—the 100 most stable, defensive names.
The market is unambiguously risk-on, and at an extreme. Investors are aggressively favoring the most volatile, highest-beta names over defensive ones, and they've been doing so for the better part of a year (+67% ROC). This is what a strong, momentum-driven bull market looks like under the hood: big risk appetite, defensives left behind.
The extremity is double-edged. The two prior times this ROC spiked to similar heights (2010 and 2021) both marked moments where the high-beta leadership soon stalled or reversed. A ratio at all-time highs with a near-record one-year surge says the trade is crowded and stretched, not that it's about to end, but historically these readings are where the risk/reward of chasing high beta gets worse.
The S&P 500 is near record highs while its internals just flashed a risk-off signal.
After similar setups, drawdowns of more than 5% have outpaced comparable gains over the next 1 to 6 months.
The broader risk warning count has climbed to 50%.
Read full analysis: https://t.co/KRyHyifIcW
$MU's trend score just hit 10, about as strong as it gets.
Optix is sitting at 94.82 though, and 20-day volatility has jumped to 117.91. That's usually what a late-stage, stretched move looks like.
Strong trends and crowded trades can look identical on a chart. Trend Score, Optix, and volatility together tell whether this is a trend with room to run, or one that's already priced in too much optimism.
Available through SentimenTrader Light Data API: https://t.co/xxRX5UyILt