Most prop research starts with a line, and Sportsbooks spends millions to beat the users with the line algos.
But the real question is: does the line actually make sense? 🧠
That’s why we built the Statyx Odds Engine 💎
Instead of jumping between 5 different tabs, you can see everything in one workflow:
📊 Live props odds across books
📈 Statyx model derived projection
🔥 L5, L10, L20 hit rate context
⚖️ Fair price + edge%
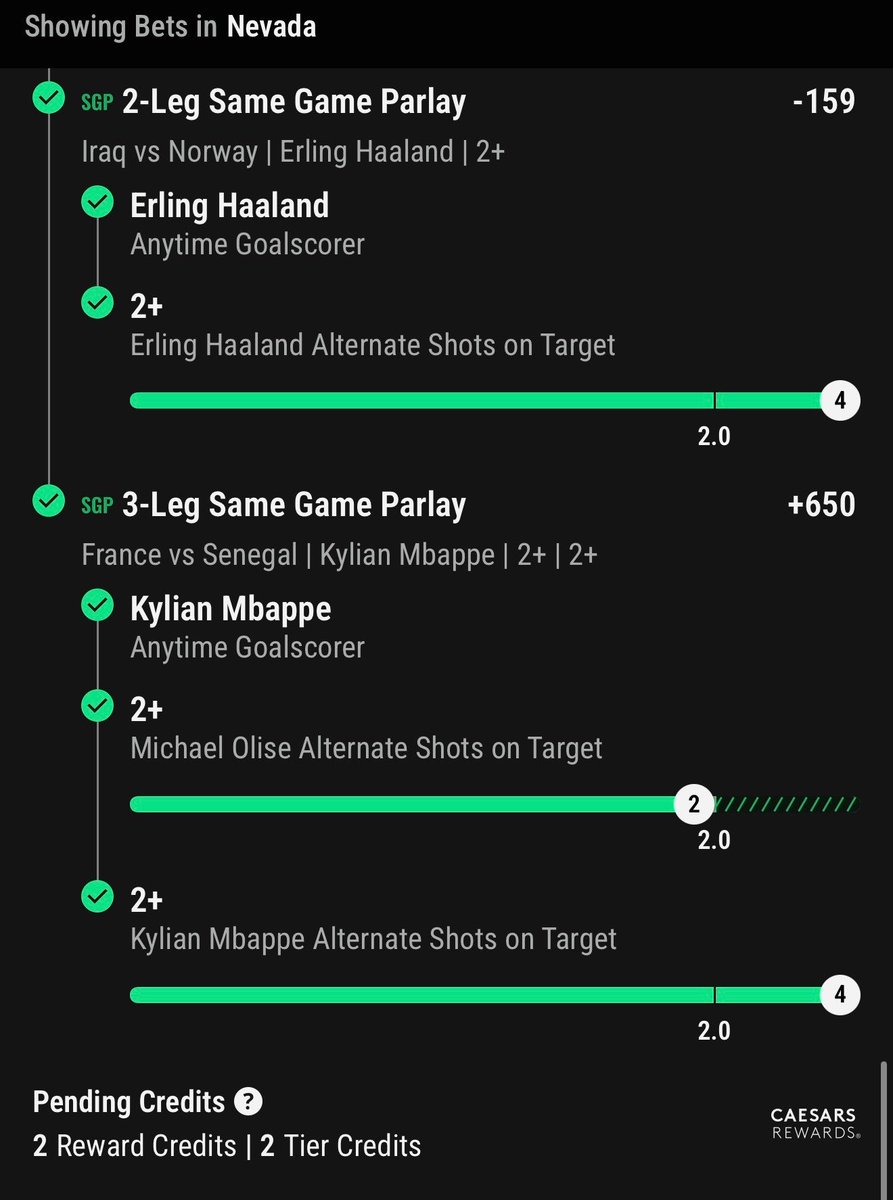
🧾 Parlay builder with slip analytics
📌 Direct tracker integration
🔗 Clean share cards for your research
The goal isn’t to throw more numbers at you.
It’s to give you the full research picture before you make a decision.
This is prop research in 2026, we are not letting you stay behind. ♥️
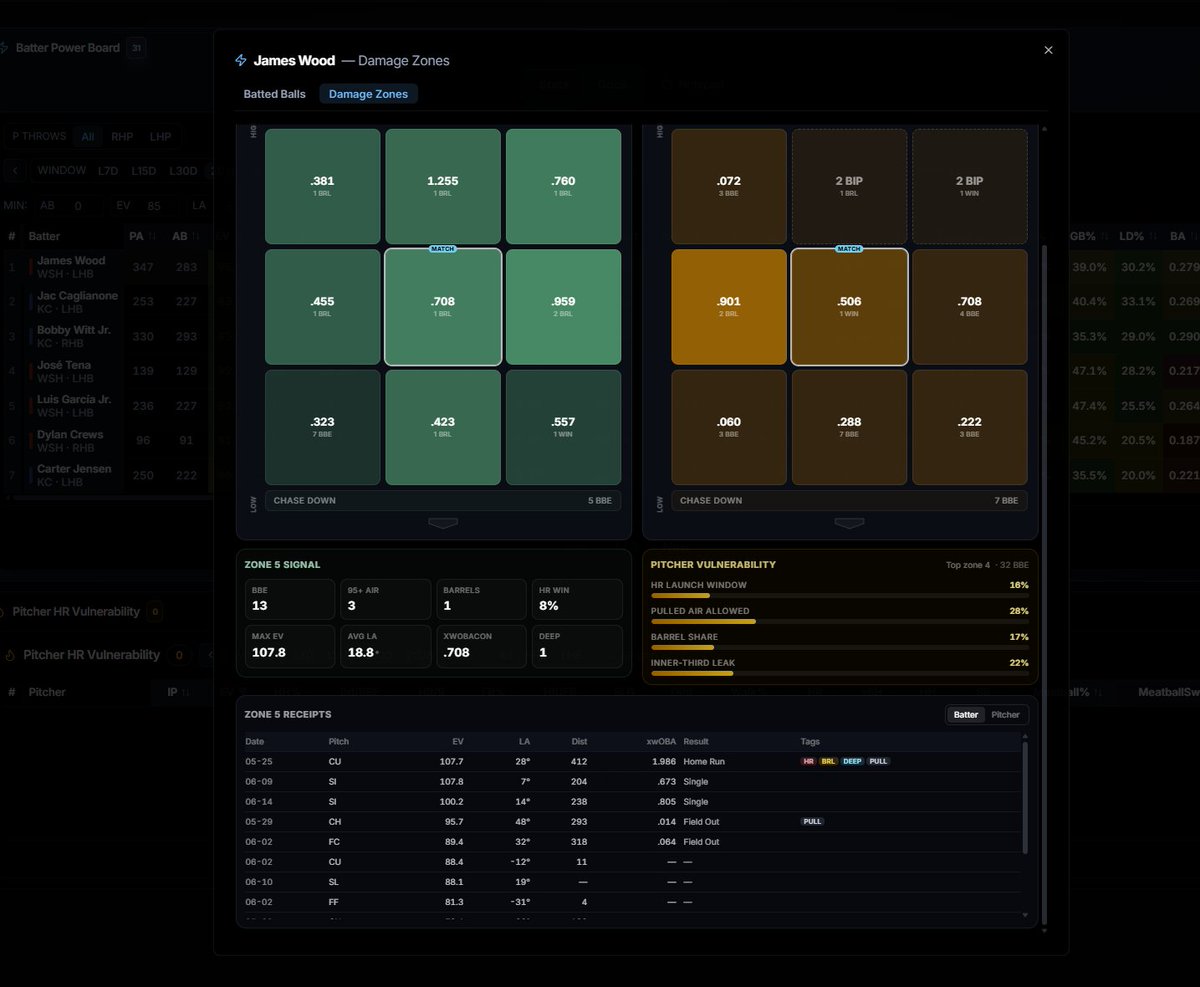
New Addition to @statyxio Batter logs: Damage Zones
Damage Zones isolates the specific pitch type and strike zone locations where a batter’s HR shaped contact profile converges with a pitcher’s documented damage allowed profile over the last 30 days.
Unlike the broader Zone Engine that we already have which goes much deeper, it is purpose built for home run analysis, emphasizing contact quality indicators such as barrels, 95+ mph air contact, launch angle windows, pulled air damage, deep contact, and verified event evidence.
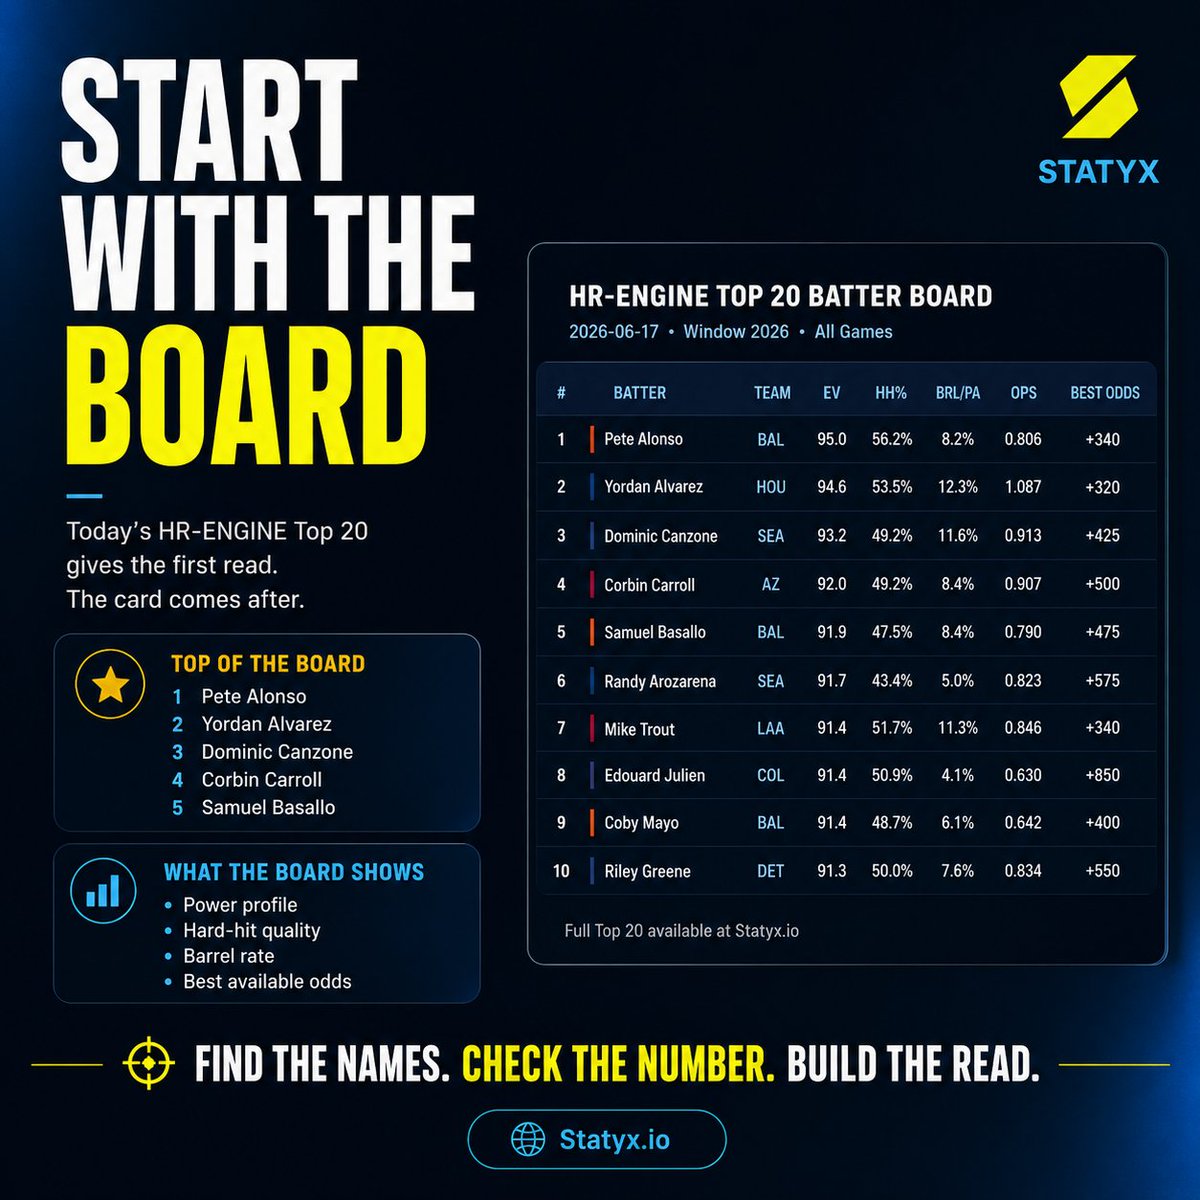
Most cards start with a name.
Better ones start with a board.
Today’s HR-ENGINE Top 20 gives the first layer:
EV.
Hard-hit rate.
Barrel rate.
HR/FB.
OPS.
Best available odds.
Pete Alonso, Yordan Alvarez, and Dominic Canzone lead the board, but ranking alone is not the play.
Find the names.
Check the number.
Build the read.
If you know a capper or creator who should be using this, send it to them.
Your card might be good.
But if nobody understands why, it just looks like another pick post.
That is the problem for a lot of betting content.
The pick is only part of it.
The reasoning is what makes people trust the read.
Matchup context.
Price context.
Environment context.
Player profile.
Statyx does not force the play.
It helps make the read easier to explain.
If you are a capper or creator trying to make your content sharper, this is the kind of tool that should be in your process.
Know someone who posts cards?
Send this to them.
Who knows, something good might be brewing from us.
The mistake is treating every board like a pick sheet.
They are not all answering the same question.
HR Engine shows where raw power is concentrated.
HR Quant shows why a name is grading well and what still needs checking.
Zone Engine shows where the matchup can actually be attacked.
ParkIQ shows when the environment or lineup changes the read.
That is the bigger value.
Not more picks.
Better order.
Better context.
Cleaner decisions.
Not every board is about forcing one name.
Sometimes the useful read is seeing where the slate is concentrated.
This single-game HR Engine board is basically WSH/KC all the way down.
James Wood leads the group by raw power indicators:
95.7 EV
58.5% hard-hit
13.0% barrel/PA
37.0% HR/FB
But the bigger takeaway is the shape of the board.
When one game fills the top 10, that is where the research starts.
Then comes the real check:
lineup,
park,
weather,
price,
and whether any number is actually usable.
A leaderboard should not end the research.
It should tell you what questions to ask next.
Today’s HR Quant top group has three different stories:
Heriberto Hernández has the power profile and park lift.
Hunter Goodman has the pitcher leak, but the park/weather is the concern.
Shohei Ohtani has the batter form, but the matchup is not perfect across every signal.
That is the point.
Statyx is not built to force every top name into a pick.
It shows why a player ranked there, what supports it, and what still needs to be checked before it becomes usable.
Top of the board is where the research starts.
Some boards do not need a pick.
They need a filter.
That is the problem with betting research.
You can have names, trends, matchups, prices, and projections all sitting in front of you, but still not know what is actually usable.
Statyx does not turn every board into a play.
It helps put the read in order.
Matchup.
Market.
Price.
Context.
Player profile.
Then you decide what actually deserves the card.
The problem with most matchup research:
It tells you who is facing who.
But it does not quickly show where the matchup can actually be attacked.
A hitter can look good overall and still have weak zones.
A pitcher can look average overall and still attack those exact spots.
That is where reads get missed.
Statyx Zone Engine helps surface the part of the matchup that box scores usually hide:
where the hitter struggles,
where the pitcher attacks,
and where the two actually overlap.
JALEN BRUNSON IS THE 2026 NBA FINALS MVP!
Brunson averaged 32.6 PPG, 4.2 RPG, 4.6 APG in the NBA Finals, leading the Knicks to their first championship in 53 years 🏆