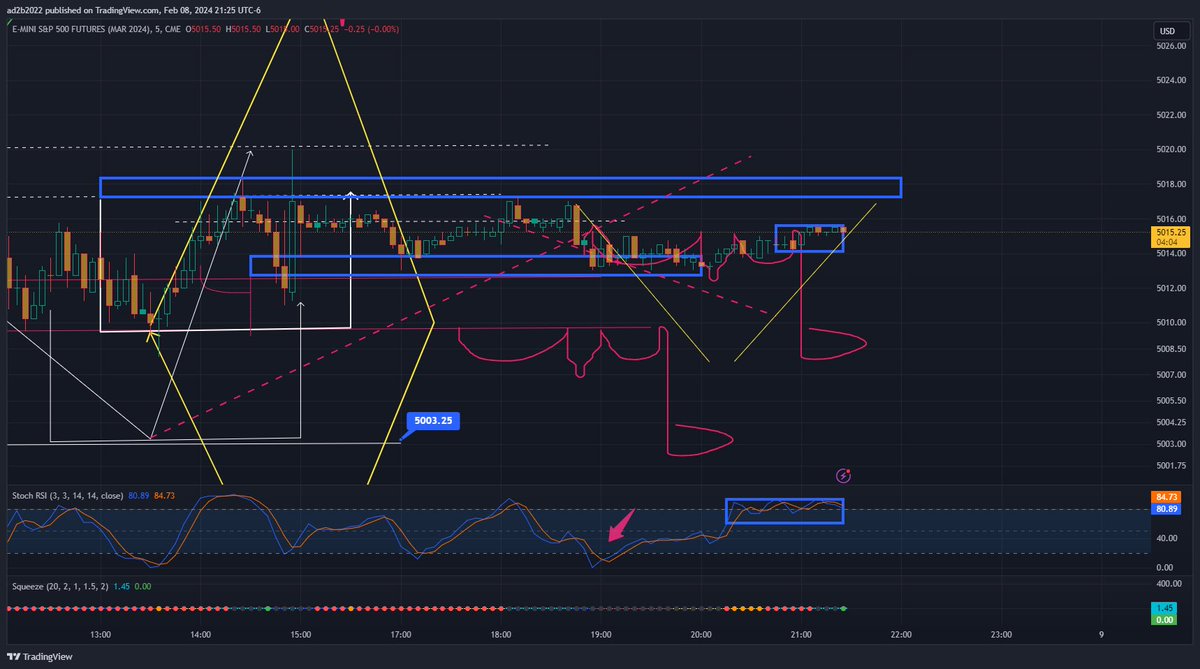
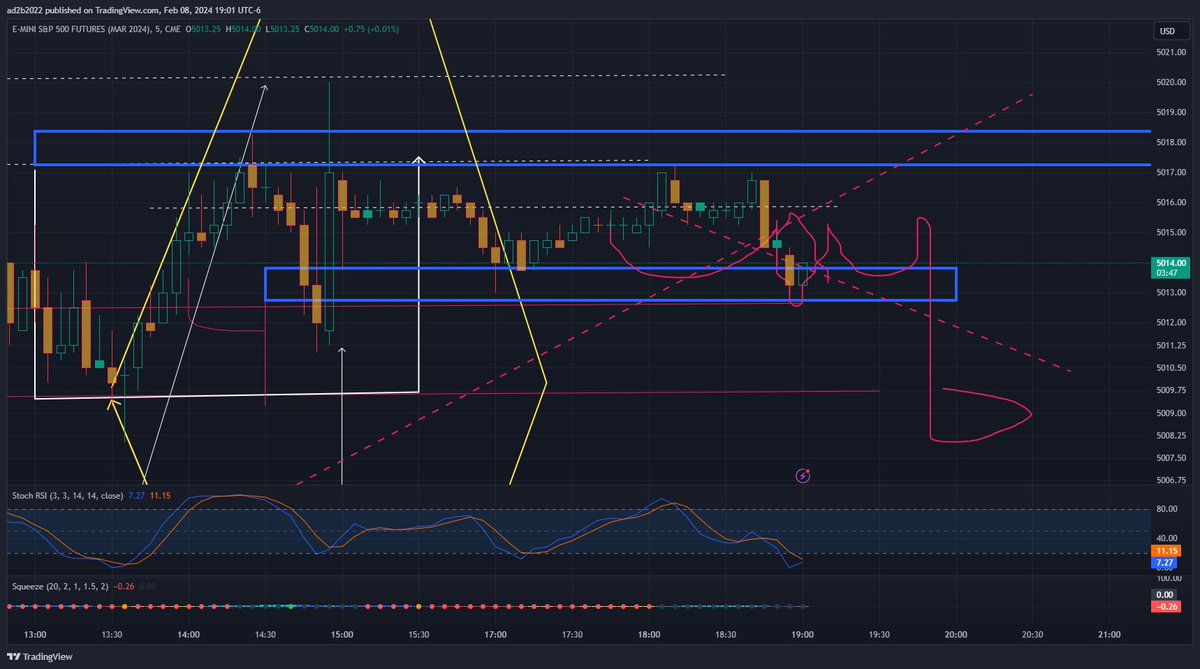
$ES fell here, pumped back in. see high rsi up top pinned is pump status, but its not actually climbing. something got hidden tonight. there is a shift in momentum coming, if not today. in coming days i'm pretty sure
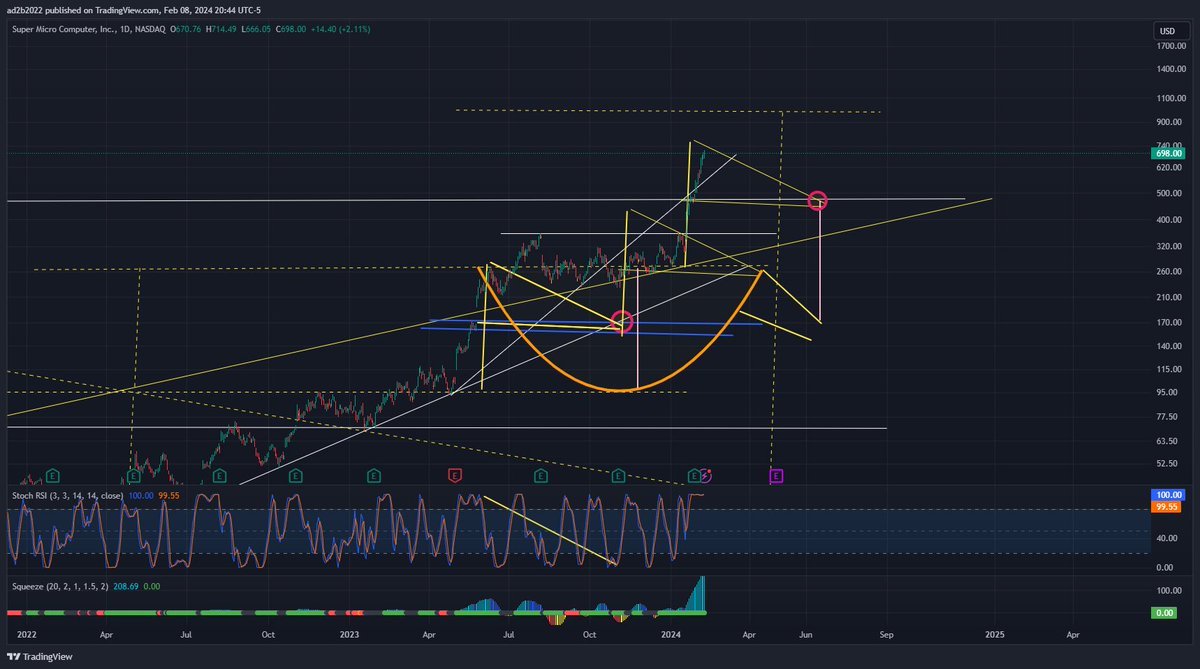
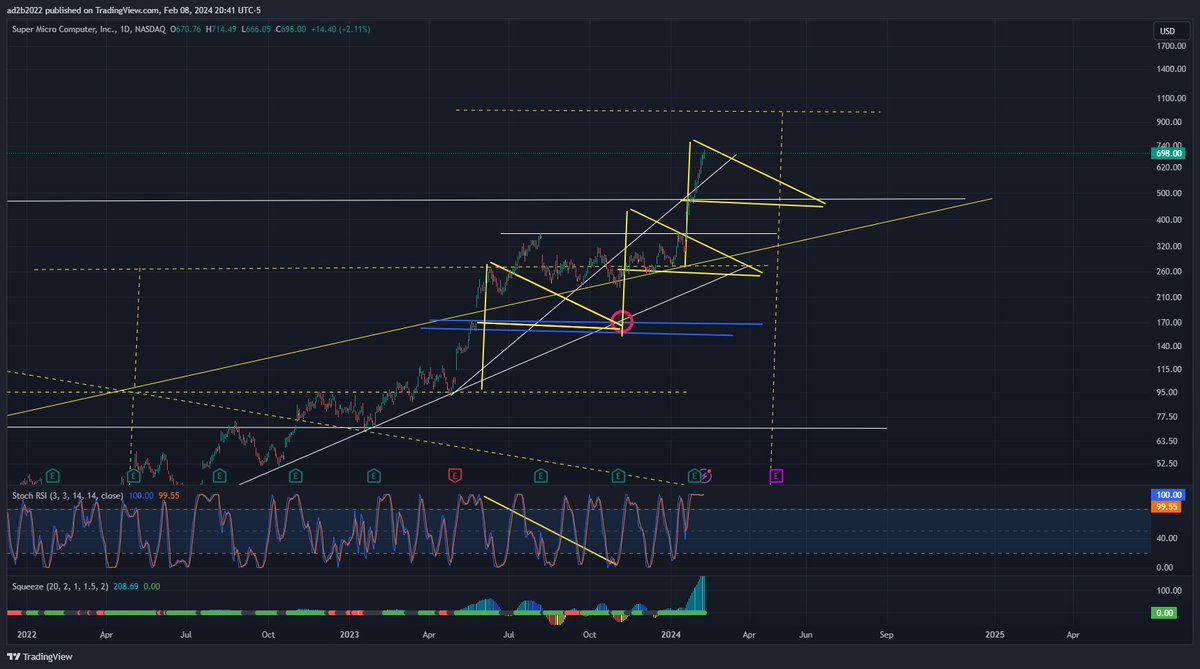
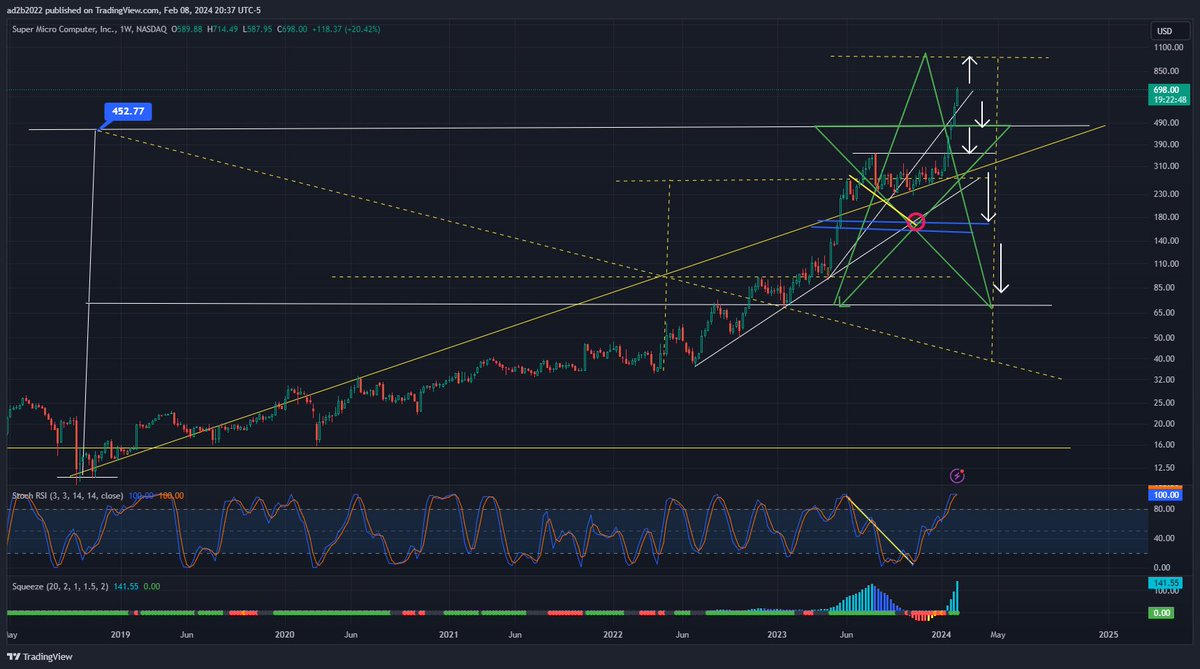
2nd flag "failed" fails down into the "cup and handle" pink bar from cup measurement right to 3rd flag. everything is calculatable, what we are not seeing, is the proper price action that makes up the moves that we see. $smci
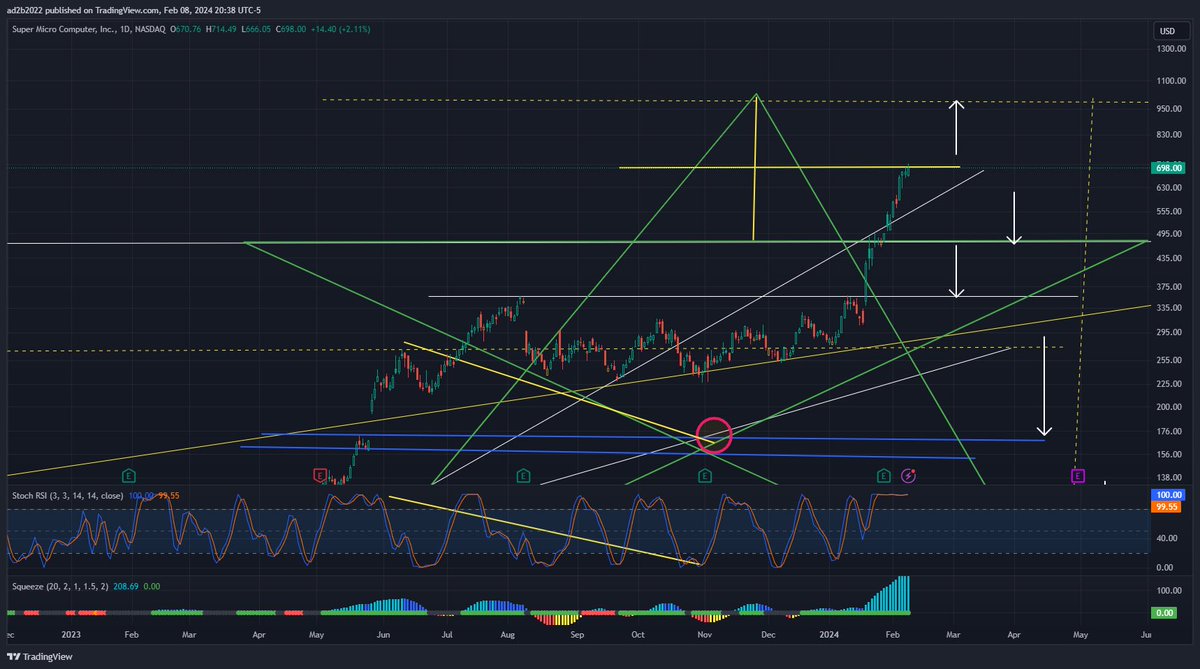
697 was 50% move to the measured peak, same thing like nvda. divergence at the yellow line in stoch, lkely down to the pink 0, but semis are just to strong to sell off, or whatever other shenanigans, i don't quite understand. but typically that is what would have happened $smci
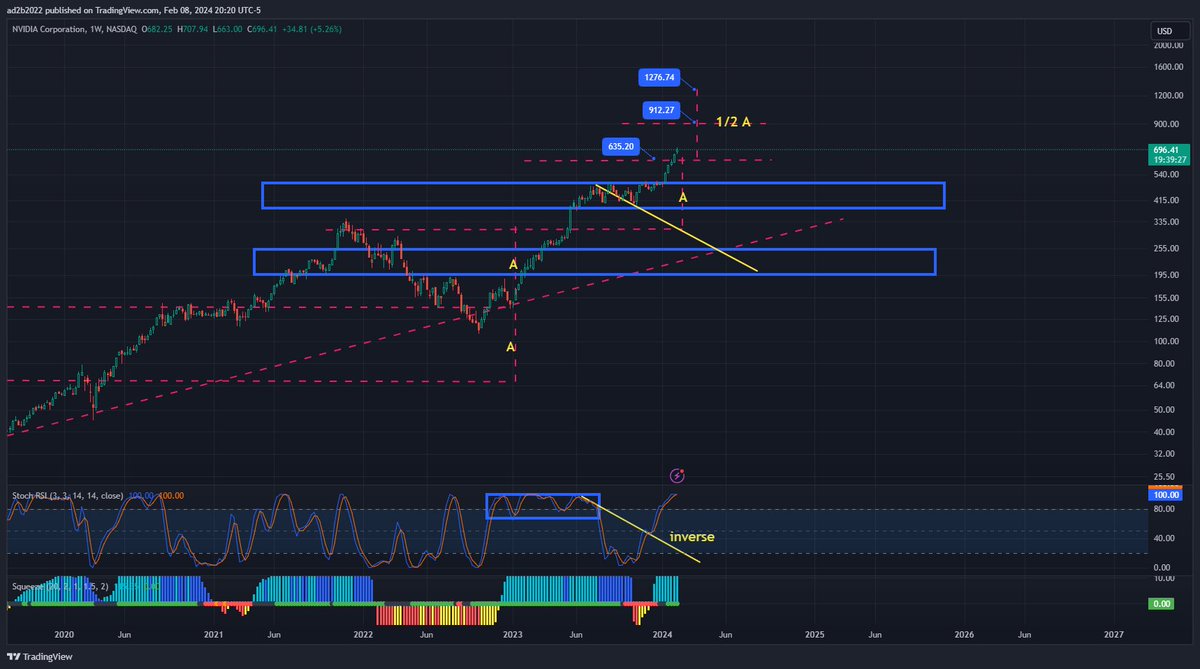
funny enough that yellow line from nvda is july 24th. and 6/26 is my nemesis. that could very well be whats floating the market, and when those buys come out and sink nvda from 700 to 200, it tanks the markets
at the first blue box is where it started pumping. likely to see this price again after the inflation 138 area, the 2nd blue box, rsi shows the weekly sell off yellow line back down towards blue box however we inverted price action instead if you notice $nvda
at the first blue box is where it started pumping. likely to see this price again after the inflation 138 area, the 2nd blue box, rsi shows the weekly sell off yellow line back down towards blue box however we inverted price action instead if you notice $nvda
nvda cliff hanging there. it may just catch and rally anyway, what it usually does. DAl if you look at the white rally from the V, its not on with the measured move, so the dip goes equal distance green and red below it. and now ES's pattern, something just feels eerie
$es $nvda
somethng going on, DAL printed big red candle. ES is showing a down trend pattern too. is there some current news that would effect the market recently released?
$dal $es