Share, create, and explore @Tableau data visualizations for free on Tableau Public. For more inspiration, view our #VizOfTheDay and connect with our #DataFam ❤️
Inspiration from the Viz Gallery at Tableau Conference ✨
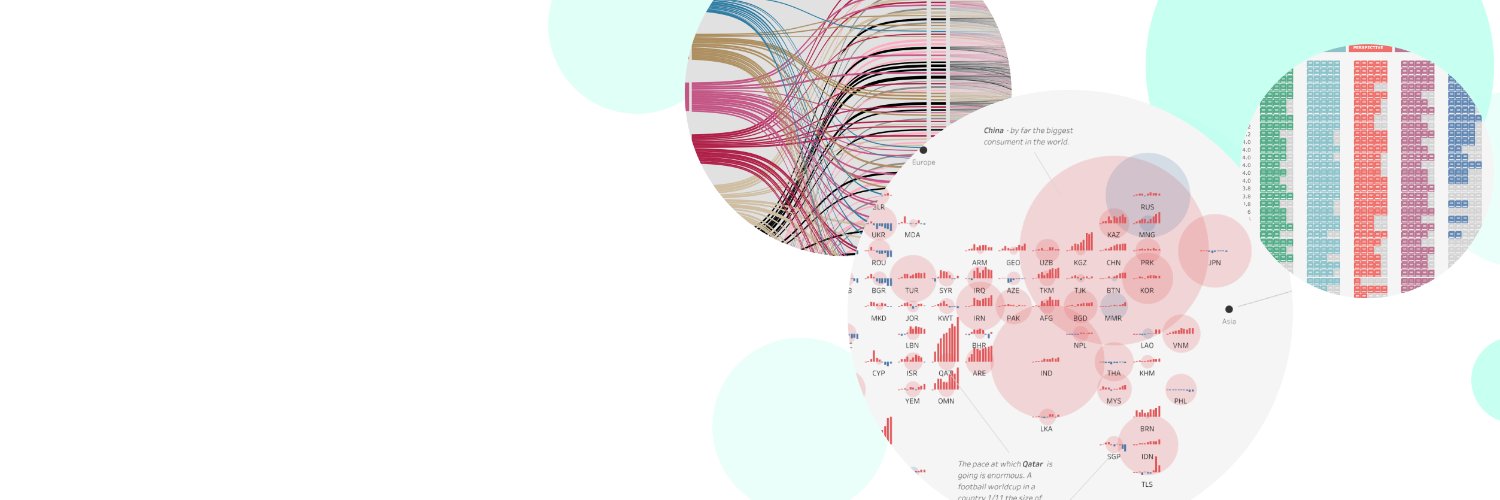
A glimpse into Tableau Public's repository of 11M+ data visualizations, the Viz Gallery at #TC25 featured a range of vizzes by the DataFam—from #IronViz to Tableau Community Projects.
Explore this #VizOfTheDay by @KhennieNectar and @VizWithVictory featuring nine real-world KPIs across six industries to help users track, compare, and better understand business performance.
Check out the viz on Tableau Public: https://t.co/HOZt9se8iJ
This #VizOfTheDay by @TIkeda93820944 uses a circular line chart to explore and show UK fuel price trends from 2013–2026 dynamically, highlighting the relationship between geopolitical shocks and energy costs.
Explore this #MakeoverMonday entry on Tableau Public: https://t.co/tLUL8uUkin
This #VizOfTheDay by @boknowsdata is a creative interactive resume built in Tableau. It visualizes his professional experience, technical skills, and extensive portfolio of work through a clean and engaging layout.
Explore the viz on Tableau Public: https://t.co/poFZ5XA5tb
Explore this #VizOfTheDay by Matt Meier featuring map layers which analyzes U.S. data center concentration, power consumption, and operator investment commitments.
A #B2VB entry inspired by Blake Fieza. Check out the viz on Tableau Public: https://t.co/QFXxEcsyr3
In this #VizOfTheDay by @pyonpyon_tab, explore the evolution of diamond-cut designs across centuries through a timeline featuring geometric silhouettes and historical sequencing.
Check out the viz on Tableau Public: https://t.co/LEJVbE4xND
This #VizOfTheDay by Mykyta Loiko provides an Executive Performance Overview.
It tracks high level business health through KPIs such as total revenue, gross profit, and customer growth trends across various regions and time periods.
Explore the viz on Tableau Public: https://t.co/M1sPNQRCU3
Explore this #VizOfTheDay by @pradeep_zen comparing the 15 highest and lowest occupations in the US that are likely to be displaced by AI using a 0–100 AI risk score from https://t.co/HMokyBUF26 submitted for a #MakeoverMonday challenge.
Check out the viz on Tableau Public: https://t.co/taC0YwhWMI
In honor of Mental Health Awareness Month, this #VizOfTheDay by Kelsey Oehrke uses a bar in bar chart, sunburst diagram, and more to highlight the complexity of the ADHD brain and gender differences in symptom presentation, diagnosis age, comorbidities, and prevalence.
Explore the viz on Tableau Public: https://t.co/EyHm7VhSD6
This #VizOfTheDay by Tawab Hussainy answers the custom analytical questions that standard health apps ignore, transforming step counts and weight data into a personalized view of habits, trends, and long-term progress.
Explore the viz on Tableau Public: https://t.co/UcWgC8lQaw
This #VizOfTheDay by @VizzingAround features a Superstore Performance Dashboard with a modern UI and dynamic KPI colors.
It offers both dark and light mode themes along with clear breakdowns of sales by region, state, and category for deep business analysis.
Explore the viz on Tableau Public: https://t.co/PU2faHtU4G
In this #VizOfTheDay, @polygonmap created a curated experiential map of Amsterdam-Centrum that guides visitors through moods and desired experiences.
Explore the viz on Tableau Public: https://t.co/6QnyTVoHJS
This #VizOfTheDay by Michael McCusker showcases advanced design techniques using Tableau Map Layers. It demonstrates how to build highly custom layered visuals including interactive tables and infographics that go far beyond traditional mapping.
Explore the viz on Tableau Public: https://t.co/2PGDUsBD5m
This #VizOfTheDay by Robin Jones provides a comprehensive cryptocurrency analysis from 2021 to 2024. It tracks price fluctuations, market trends, and trading volumes for major digital assets, offering insights into the volatility and growth of the crypto market over four years. Inspired by @VizWithVictory.
Explore the viz on Tableau Public: https://t.co/hzI7MlYwjP
Explore this #VizOfTheDay and 2026 #IronViz championship dashboard by @KevinWee90, which debunks common myths about graphic novels and reveals how the medium has evolved into one of the most emotionally rich and culturally significant forms of modern storytelling.
Check out the viz on Tableau Public: https://t.co/zeWtTYNtvk
This #VizOfTheDay by @BMooreWasTaken explores why literary classics often score lower on Goodreads than modern fantasy hits, linking reader psychology, required reading, and the fantasy boom to shifting ideas of enjoyment. This #IronViz top 3 championship viz asks: is it always Hogwarts over Hemingway?
Explore the viz on Tableau Public: https://t.co/SpgNHz2d8M
This #VizOfTheDay by Ann Pregler turns Goodreads data into a whimsical exploration of genre mashups, from the rise of paranormal romance to the next big literary combo.
Through playful storytelling and sharp analysis, this 2026 #IronViz winning viz proves there’s a niche mashup for every reader.
Explore the viz on Tableau Public: https://t.co/XQP6HIi76v
This #VizOfTheDay by @Babajide_Tobi provides a daily administrative sales overview. It compares today’s sales, profit, and quantity to previous performance while highlighting top customers and categories.
Explore the viz on Tableau Public: https://t.co/VJ8ugyxMPB
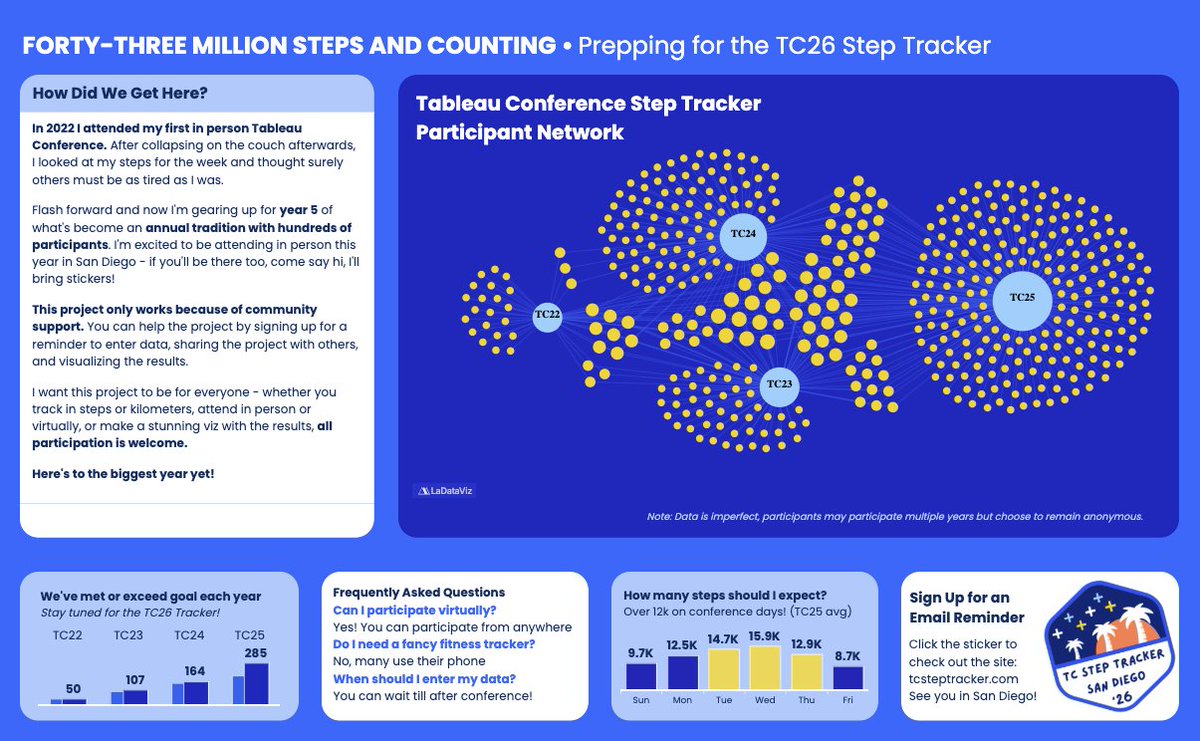
Don’t forget your walking shoes for Tableau Conference #TC26. Check out this #VizOfTheDay by Brittany Rosenau to explore step data dating back to TC22—and come back after TC26 to see the results. See you in San Diego!
Explore the viz on Tableau Public: https://t.co/99mo98KuW5