I had a ton of Interest for people asking about how I trade the IB (Initial Balance)
I'm going to break it down in this thread, along with a video that will give you EVERYTHING you need to make money with it!
This WILL get you more payouts! (A Thread)
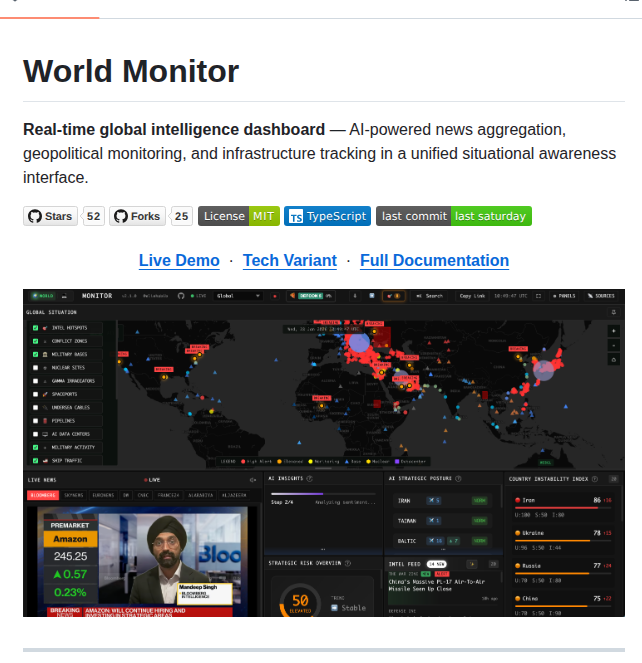
🚨 Someone just built a real-time global intelligence dashboard and open sourced it for free.
It's called World Monitor. Think of it as a CNN war room meets Bloomberg Terminal for geopolitics but anyone can use it.
No paid OSINT tools. No expensive subscriptions. No classified access needed.
Here's what this thing tracks in real-time:
→ Active conflict zones with escalation scoring
→ 220+ military bases from 9 countries
→ Live military aircraft tracking (ADS-B)
→ Naval vessel monitoring including "dark ships" going off radar
→ Nuclear facilities worldwide
→ Undersea cables, oil pipelines, and AI datacenter clusters
→ Protests, sanctions, internet outages, and satellite fire detection
→ Prediction markets as early warning signals
Here's the wildest part:
It has an AI that reads 100+ news sources, classifies threats in real-time, and generates intelligence briefs automatically.
Every country gets a live "Instability Index" score from 0-100 based on military activity, protests, news velocity, and structural risk.
When 3+ signal types spike in the same area, military flights + protests + satellite fires, it triggers a convergence alert.
This is the kind of tool governments pay millions for.
It runs in your browser. One command to install.
100% Open Source. MIT License.
I’m seriously considering moving from my home-made scripts to a more universal framework for backtesting + live trading (especially for intraday). Tested NautilusTrader today and it looks very interesting.
Why it caught my attention:
- Open source
- Event-driven Python API, Rust core (fast)
- Biggest win: same strategy codepath for backtest and live (no “version 2” rewrite)
- Because it’s Python, Claude Code can actually help you ship strategies without coding.
I ported my intraday volatility breakout strategy in minutes.
Anyone here running NautilusTrader live?
What’s your experience with brokers/data/execution - any gotchas?
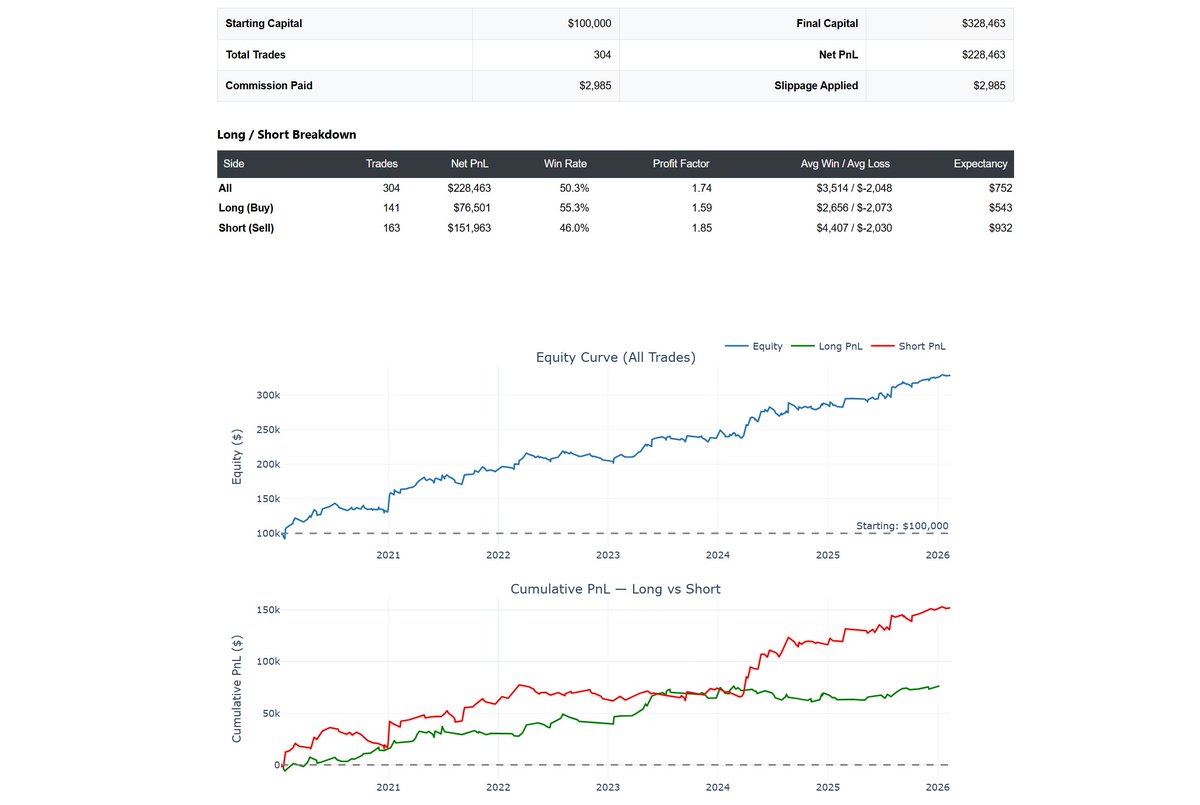
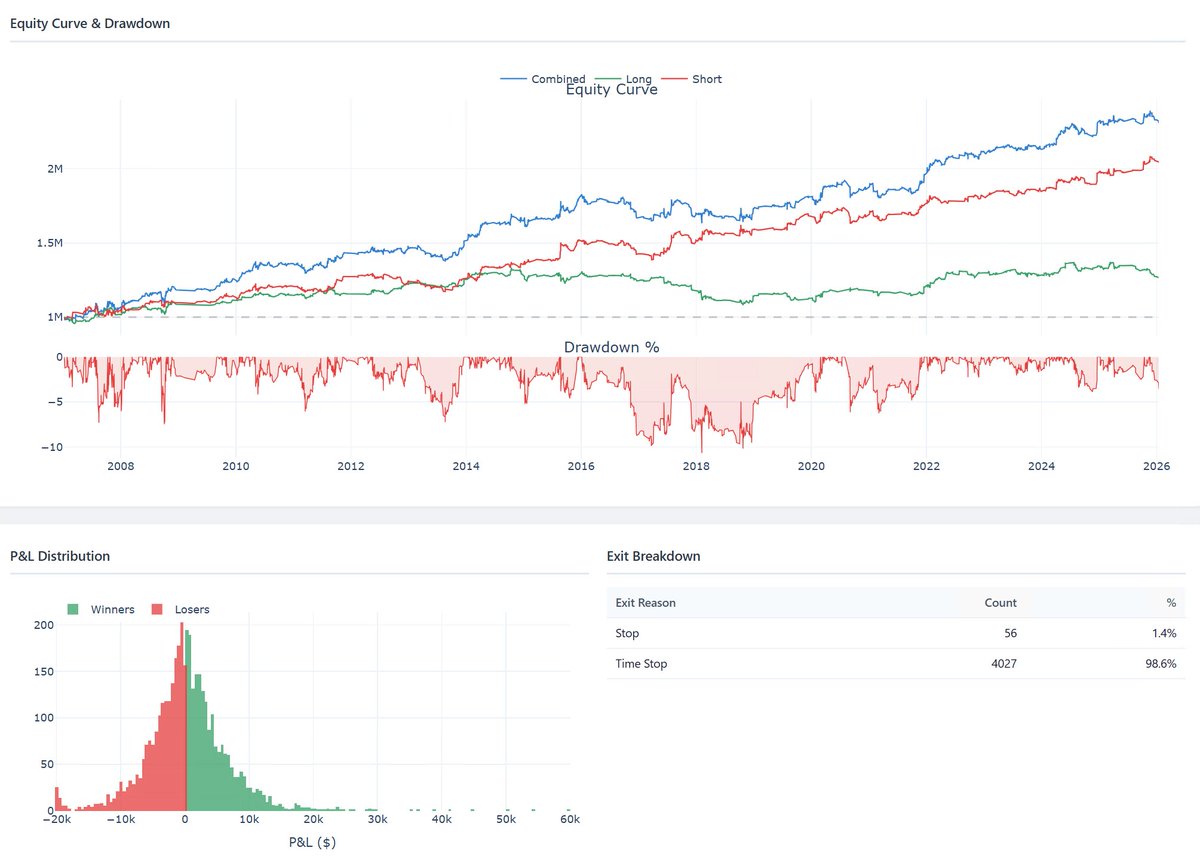
Interesting “micro-edge” I shared last week keeps showing up across markets - here’s NQ (30-min).
Idea: when a 30-min bar during RTH is unusually large vs its own time-of-day history, the next 30-min bar tends to continue in the same direction.
How I test it:
- Measure |Close-Open| each 30-min bar
- Signal if it’s > 95th percentile of that SAME slot over last 120 days (09:30-10:00 has its own distribution, etc.)
- RTH only: 09:30-16:00
- Enter next bar open, trade in signal direction
- Stop = 0.5x ATR(5) (prev day), but…
- Exit is basically always a time stop (1 bar hold) - ~98.5% of exits
- Both long + short (and I actually like the short side best - red line)
Big caveat: NOT tradable as-is (zero fees/slippage).
But with 4,083 trades on NQ alone, it’s exactly the kind of “high-sample” tendency where a couple simple filters can turn it into something real.
I live in two trading “AI bubbles”.
Bubble A: systematic traders using AI like a research pipeline - hypothesis -> code -> backtest -> sanity checks -> report. They’re not “printing money” - but they move faster with fewer people and catch more mistakes before they hit production.
Bubble B: traders who tried a chatbot twice, saw a hallucination, and decided “AI is useless”.
The gap isn’t intelligence. It’s workflow stage.
4 stages of AI in systematic trading - where are you?
Stage 1 - Answer bot
Ask questions. Get ideas. Copy/paste. Useful, but fragile.
Stage 2 - Co-pilot
AI lives inside your tools (IDE, docs). You still drive every step - just with less friction.
Stage 3 - Analyst agent
“Read my backtest logs, find inconsistencies, propose 3 filters, draft the spec + test plan.”
You steer what, not how.
Stage 4 - Research loop (real for research, not hands-off trading)
You give a spec + guardrails + a test harness. Agents can iterate: implement -> run tests/backtest -> model fees/slippage -> basic walk-forward -> checks (survivorship, slippage, OOS) -> report.
Fail a check? Fix and retry. Not magic - verification loops + persistence.
Still hurdles - but the workflow improves every month.
Systematic takeaway:
Most traders stop at Stage 1-2 and call it “using AI”.
The compounding comes from Stage 4: reproducible research, data validation, and automated sanity checks.
Reply 1-4: where are you right now?
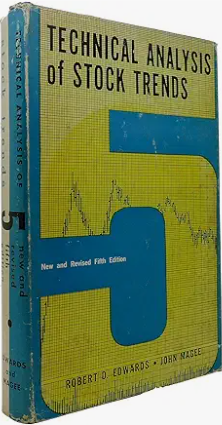
So you want to learn the proper ways to analyze charts?
Forget the modern books
Go back to the originals on classical charting to find out the rules on how charts should be interpreted
Schabacker's 1934 book - in hard cover
And Edwards & Magee (1948) - 6th edition OR OLDER ONLY. All editions newer than the 6th edition have been altered. The newer editions are simply spoofs - they have been altered irreparably
Order Schabacker here
https://t.co/GhY4hLGmrI
If you keep losing money trading, try this one simple trick…
When you feel like you should enter a trade, market buy with $1 and set your stop loss like you usually would
Then when your stop loss/liquidation is almost hit, enter your actual trade.
You’re now trading like a whale and buying retail stop losses and liquidations 👍
@yuriymatso Why did you restructure methodology pages for Main strategies (Gemini, mercury etc) on site? The earlier structure was very insightful for those strategies.
Comment on so many charts posted on X
Traders today seem to make up their own rules about classical chart patterns
There are rules
They were codified in a 1934 book by Richard W. Schabacker
Learn the real rules. Buy/read the book https://t.co/mTzGT1Ae5N
My $SPY strategy is simple:
• One trade a day
• Trade the open
• I don’t fight the trend
• Calls at pre-market low support
• Shorts at pre-market high rejection
• Hold 10 minutes max
• Take profits fast
• Walk away
No overtrading.
No hero trades.
Green is green. 📉📈
Use this simple trick to decide whether to enter at breakout or pullback:
1. Check if the breakout candle range is more than 2x ATR.
2. If yes, avoid entering it and wait for pullback to enter.
3. You will get better risk reward than chasing breakouts.
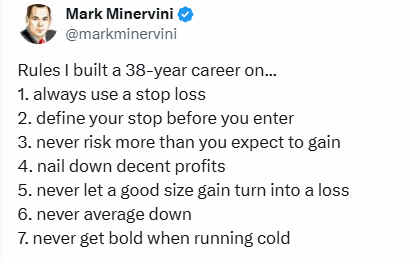
99% of superperformance stocks did THIS before their massive breakouts...
Most traders chase stocks after they've already moved. They buy the hype, ignore the trend, and wonder why they keep losing money.
Mark Minervini studied decades of market winners and found something remarkable: virtually every stock that delivered life-changing returns followed a specific, identifiable pattern before the big move happened.
It's not luck. It's not insider information. It's pure technical structure.
Below is Minervini's exact 8-point Trend Template, the same checklist he uses to filter every single trade. Miss even one criterion, and he won't touch it, no matter how good the story sounds.
Master this, and you'll never chase a stock blindly again. 👇
I’ve said it for years: strategy creation is NOT complicated.
And nothing proves that more than this breakout model.
It uses one input, one bar, and still delivers ~$112 per contract.
Here’s the structure I trade.
> Market: EMD, 30-minute, full 24-hour data
> Yesterday must be an up day
> Today’s high must have already traded above yesterday’s close
That’s my trend filter and it needs zero optimization.
I only take trades from 8:00–15:00 Chicago time.
Entry = last close + 7 points
If the breakout hits, I enter long immediately.
I use a $1,000 protective stop.
And I exit at the next bar’s open, no exceptions.
This little setup is far more robust than most traders expect.
Watch the video and get the free resource in the comments.
In 2014, Peter Thiel gave a 1-hour masterclass on how to build a monopoly from scratch.
He broke down how:
• Google became untouchable
• PayPal beat the odds
• Facebook crushed competition
Here are 11 timeless lessons from his masterclass:
1. Create value, then capture it