Bitcoin's complete playbook for next week. I have tested every level against 450 weeks of data.
This week is closing around $76,000 which is a 7.2% gain from Monday's open. But the high was $78,333 on Friday and Saturday gave most of it back with a 1.79% dump and Sunday only recovered half of that.
The weekly candle is closing at 70% of its range which means price is not closing near the highs where you want to see strength, it is closing in the upper half but with a clear rejection wick above.
That matters for next week because a weekly close at 70% of range after breaking a prior week's high has historically been followed by a red week 62% of the time. Not a guaranteed sell but worth knowing before you go all in on Monday.
Here is what the data says about next week based on where Monday and Wednesday close.
If Monday closes above $79,800 which is 5% above the open, the week has closed green 89.6% of the time historically and since 2021 that number is 95.5%.
If Monday closes above $79,116 which is 1% above this week's high of $78,333, that confirms price is not just wicking above resistance but actually holding above it and historically that means the breakout is real.
If by Wednesday the week is still up more than 3% from Monday's open, the week closes green 86% of the time across 141 occurrences and if it is up more than 5% by Wednesday that jumps to 91.4% across 93 occurrences.
On the bearish side, if Monday closes below $74,480 which is 2% below the open, that confirms the Friday pump was a trap and the Saturday rejection was the real move.
If by Wednesday the week is down more than 2%, the week closes red 80% of the time and in the last 3 months specifically that number has been 100%, 5 out of 5 with zero exceptions.
And if Monday somehow closes below $69,861 which is 1% below this week's low of $70,567, that is a full sweep of the weekly range and historically the rest of the week bounces green 81.8% of the time. That is the level where you buy, not sell.
$79,800. $79,116. $74,480. $69,861. These four numbers are your entire week. Bookmark and check them Monday and Wednesday.
Tomorrow is the 14th.
Over the past 10 months, 7–10 days after the 14th, $BTC has consistently retraced any upward moves.
In some cases, there’s been a brief 2–3 day push higher, a liquidity hunt, before the market reverses.
The key takeaway is that between the 14th–24th, we are more likely to see bearish PA instead of bullish PA based on this pattern, which has persisted for nearly 300 days.
The real question now is: do we get that initial pump (the early liquidity grab) a few days after the 14th, or does price reverse immediately from the date?
Either way, the outcome has consistently favored more downside than upside.
What if I told you that Bitcoin's weekly close is already decided by Wednesday night and you can predict it with 85% accuracy?
I tested 451 weeks of data since 2017 and found that if Bitcoin has not pushed more than 1% above Monday's opening price by Wednesday night, the weekly candle closes red with 85% accuracy. The chance of this being a random event is only 1 in 100,000.
The accuracy increases with every day that passes:
Monday close: 61% red
Tuesday close: 72% red
Wednesday close: 85% red
Thursday close: 90% red
Each day that passes without bulls breaking above the open, the probability stacks higher against them.
The reverse also works. If Bitcoin has not dropped more than 0.5% below Monday's open by Wednesday, there is an 86.5% chance the week closes green.
The week is not decided on Friday, it is actually decided on Wednesday and everything after that is just price catching up to what was already determined 3 days earlier.
Bookmark this. Use it every week.
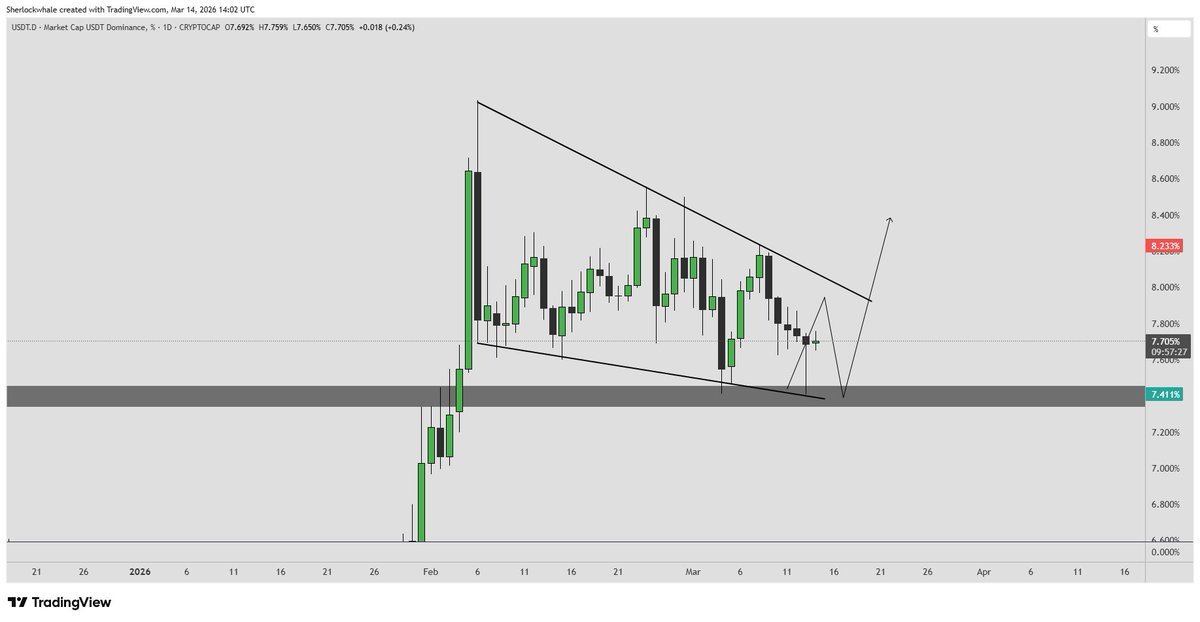
How long before USDT dominance breaks out of this falling wedge and continues the trend?
Dominance has been consolidating inside this wedge since the start of Feb and the trendlines converge around FOMC next week.
Oil up 30% in a month. CPI came in hot. GDP revised down from 1.4% to 0.7% yesterday. So, the Fed has zero reason to cut.
No rate cut = no new liquidity. No liquidity = no bid for Bitcoin
The people buying Bitcoin at $70K right now are about to learn a very expensive lesson.
$60K again before the end of March.
@Sherlockwhale@foxianorg Good to see a community approach being applied to Forex. When traders share reasoning, macro context, and risk frameworks, the learning curve improves a lot.
Launched a Forex community under @FOXIANORG
We’ve been running our crypto community of 10,000+ members for the past 4 years. Now we’re bringing the same structure to Forex.
First 1,000 members to join the community will get the lifetime free access. 400+ spots have already been taken.
Also activated a 100% deposit bonus for Forex members. Whatever amount you deposit, you will get 100% free trading bonus.
Link below to join. 👇
https://t.co/iQRILyAo1E
This is getting wild…
Weather Clawdbots are now fully automated on Polymarket
One account is up $60,000+ and the activity is ramping fast
Profile: https://t.co/CKjH4i7A64
Want the same setup? Here’s the guide
Bitcoin will bottom in October 2026 between $37,000 - $43000.
I have analysed 3,100 days of price data across 3 complete cycles.
Every Bitcoin bear market lasts almost 377 days.
1- 2017 top to 2018 bottom: 363 days
2- 2021 top to 2022 bottom: 376 days
3- 2025 top to bottom: Day 127 of 377
I used five completely independent timing methods and surprisingly they all point to the same month and that is October 2026.
We're not even halfway through this decline. Sell now and buy in October again.
Screenshot this.
Screenshot this for summer 2026:
Bitcoin under $40K
Ethereum under $1000
Solana under $30
That’s where I’m buying, not at these clown prices. All those buying right now are the exit liquidity.