Zabbix is an enterprise-class open source monitoring solution designed to track, record, alert and visualize performance and availability of IT resources.
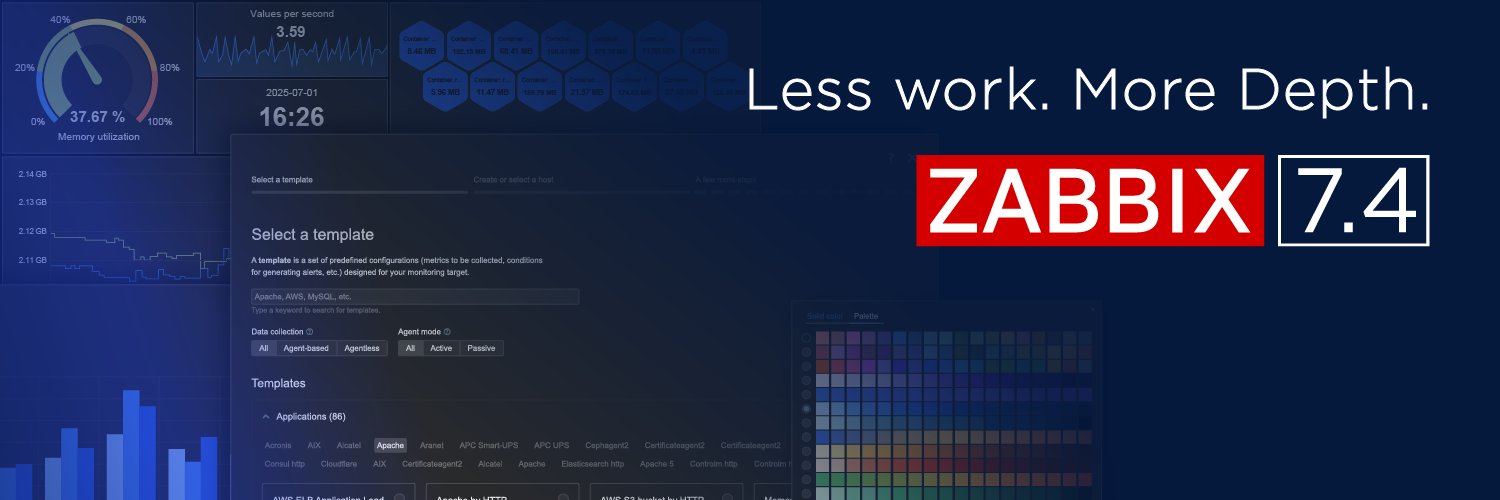
Zabbix 7.4 is out!
Highlights:
- Host Wizard for easy host configuration
- Nested LLD for complex multi-tier environments
- Inline field validation in forms to catch errors instantly
- Live dashboard editing for real-time visual customization
More: https://t.co/Oybj4Eq76H
What if flipping your graphs could help you spot trends faster? In Zabbix 8.0, inverted graphs let you flip selected datasets on the Y-axis, making it easier to compare metrics side by side and uncover new insights. See it in action here: https://t.co/ATTHmczLDY
The Zabbix engineers, developers, and product leads will all be in one room in Riga this October. Ask the questions you can't raise in a support ticket.
#ZabbixSummit 2026 – Early Bird ends July 29: https://t.co/qYxiVU70kq
Monitoring your Amazon ECS environment with Zabbix gives you a complete picture of ECS resource consumption that helps you maintain application reliability, optimize capacity planning, and control cloud costs.
Learn more here: https://t.co/uuzxt0qpBL
What's coming in Zabbix 8.0 LTS? The roadmap has been updated with the latest progress on features designed to help teams scale monitoring, simplify operations, and gain deeper visibility into their environments.
Take a look now: https://t.co/hCJf6rkkeS
The YugabyteDB + Zabbix integration is designed to keep your YugabyteDB clusters stable, balanced, and highly available with full-stack observability powered by Zabbix. Find out more: https://t.co/SsVCfa0ecL
The new Scatter Plot widget in Zabbix 8.0 transforms raw monitoring data into actionable insights by showing the relationship between any two metrics at a glance. Take a look at our latest Handy Tips video to learn more: https://t.co/yAv6Lgfg59
Windows servers power many business-critical services. Join our free webinar to learn how to gain better visibility into server health, identify issues earlier, and troubleshoot more effectively with #Zabbix.
📅 June 18, 2026 | 10 AM CDT: https://t.co/Wxa8fWmebM
The Zabbix Jira Data Center JMX integration lets you go beyond basic uptime monitoring, giving you complete visibility into Jira Data Center health and delivering a more reliable user experience: https://t.co/4h9OYiPhdH
Need flexible monthly billing? Prefer predictable annual budgeting with 10% savings? Require invoice-based purchasing?
#ZabbixCloud now supports all three, giving you more control over how you manage your subscription.
Choose what works for you: https://t.co/S1JRudtfWk
What if you could stop staring at dashboards and simply ASK your infrastructure what's happening? Check out our latest #ZabbixBlog post to see how it can be done: https://t.co/dZ9GO2CeEX
Lost resources don't have to mean lost data!
Join us for a new Zabbix Handy Tips video and learn how low-level discovery can help you automatically manage resources, handle lost entities the right way, and avoid unwanted data loss: https://t.co/G2dXIR958T
Join our free webinar this Thursday on Zabbix proxies and distributed monitoring.
🔗 https://t.co/l8lHdCR59g
Learn how to keep visibility across remote sites, improve resilience, and scale monitoring in real-world environments, even with unstable connectivity.
Have you considered that your firewall is only reliable if it's fully visible? The #Cisco Secure Firewall integration for Zabbix helps you detect issues before they become outages or security blind spots.
Learn more and download it today: https://t.co/SsaUVUtxmv
@CiscoSecure
Up to 35 sessions. Two conference days. Zabbix 8.0 LTS, real migration stories, AIOps, and yes, monitoring sound from space – all that at #ZabbixSummit 2026 on October 7-9 in Riga, Latvia.
Early Bird closes July 29 👉 https://t.co/9a3HYEFuPs
Take a look at our latest Handy Tips video to see how you can turn data into insights with business service monitoring and automated SLA reports in Zabbix: https://t.co/03u7VvozoJ
Join the next Zabbix/CapMon User Group Meeting for an afternoon of technical talks, knowledge sharing, and networking with fellow tech professionals and Zabbix users! See the full agenda and register here before June 3 in order to attend: https://t.co/Cc6wXjDTVH
Zabbix 8.0.0beta1 is out now.
The update improves how teams work with monitoring data day-to-day, with more flexible graph visualization, customizable table views, and expanded inline validation to help reduce configuration errors.
See release notes: https://t.co/jOUJtIErac
With the Zabbix integration for monitoring Juniper MX via NETCONF, you get deep observability with exceptional flexibility by leveraging a protocol that Juniper has actively championed and supported from its very inception: https://t.co/jMLiaIpHp9
Most people start learning Zabbix by simply using it day to day. The Zabbix Certified User course helps connect the dots faster – dashboards, triggers, maps, reports, problems, and more.
📍 GMT+8 English session available on July 24.
Full schedule: ➡️ https://t.co/D2ML35eEu9