Can you answer this GMAT Overlapping groups question? Out of 100 firms, 62 use Cloud tools and 48 use AI. 30 use both. How many use neither?
GMAT Math Walkthrough: The Double-Counting Trap 📊🧠
The GMAT doesn’t just test your arithmetic; it tests your logical awareness. The “Double-Counting Trap” is engineered to catch students who rush the data without mapping the overlap. Here is how to bypass it using the Inclusion-Exclusion Principle.
The Setup:
You have a strict absolute limit:
100 total firms.
62 use Cloud.
48 use AI.
30 use both.
The Trap:
If you rush, your brain wants to just add the two main groups together: 62 + 48 = 110. But the prompt explicitly states there are only 100 firms. You just fell for the mathematical impossibility trap.
The True Solution (Inclusion-Exclusion):
The error happens because the 30 firms using both tools were counted twice—once in the Cloud group, and once in the AI group.
1. Subtract the overlap: 62 + 48 = 110. Now, subtract the 30 double-counted firms. 110 - 30 = 80. This means exactly 80 firms use at least one tool.
2. Find the remainder: Subtract that true total of 80 from the absolute maximum of 100 firms.
100 - 80 = 20.
Exactly 20 firms use neither tool. By isolating the overlap, you sidestep the engineered trap and secure a high-leverage quantitative score.
Turn wasted screen time into verifiable competence.
https://t.co/dmtmE4o15p
#gmat #gmatprep #gmatmath #mba #businessschool #gmatfocus #gmattestprep #mbaprep
Always, but especially after early 2020 these markets have become a shameless capital-draining machine. Some put it as "crime season"
You can still play the game, you can still win, but understand the board you are sitting at. Your toughest opponents are not random retail traders with indicators and YT thumbnails. Your real opponents are whales with 99 out of 100 cheat codes: information, liquidity, influence, market access, political protection, media reach, private deal flow, and the ability to move narratives before you even know they exist.
When you truly learn to read markets, you stop seeing candles as random movement. You start seeing extraction. You start seeing who is being trapped, who is being fed hope, who is being used as liquidity, and who is quietly walking away richer while selling the public words like:
Progress,
Innovation,
Freedom, and...
saving humanity.
Give the wrong people enough capital, enough influence, and enough distance from consequences, and they stop seeing society as people. They start seeing it as fuel.
Fuel for their status, for their empires, for their vision. Fuel for whatever private longevity project they convinced themselves justifies the damage. They do not care who gets destroyed, as long as it is not themselves. They do not care who is here in 200 years, unless they believe they can still be here in 200 years. So they drain the present while pretending to build the future.
Belief is liquidity.
Most traders still do not understand this.
In accumulation, retail has to give up.
They sell because they are tired, bored, scared, liquidated, reading bearish news, seeing hacks, and believing the asset is dead.
That is when the big side can buy.
In distribution, retail has to believe.
They buy because the news is bullish, the narrative is clean, the hype is everywhere, and everyone is talking about the next markup.
That is when the big side can sell.
Markets are reverse psychology.
They make you hate the asset when you should be studying accumulation.
They make you fall in love with the asset when you should be studying distribution.
Price only moves when the big side is positioned.
Until then, the market will keep creating pain, boredom, hope, fear, hype and liquidity.
This is why trading is probabilities, not certainty.
You can have the best thesis in the world and still lose the trade.
That is normal.
Your job is not to be right every time.
Your job is to execute the model, define invalidation, know the target, and risk an amount you can survive.
Clear stop loss.
Clear TP.
Clear risk.
No ego.
The market does not care about your belief system.
It uses it against you.
Volume Spread Analysis #VSA Question: In the context of market cycles, what is the primary difference between a shake-out and a genuine breakdown?
Caption:
The Answer: The background must be free of distribution signals for the move to be a shake-out.
Here is the step-by-step Volume Spread Analysis (VSA) breakdown of why context dictates market direction:
1. Context is King
In VSA, you can never read a single price bar in a vacuum. A sudden, sharp downward move in price can mean two entirely different things depending on the structural market cycle that preceded it.
2. The Shake-Out
A shake-out is a deliberate maneuver by institutional players to flush out weak, panicked retail holders before driving the price higher. However, for a sharp drop to be classified as a true shake-out, the broader market background must be strong (an accumulation phase). The background must be completely free of distribution signals.
3. The Genuine Breakdown (Markdown)
If that exact same sharp downward move occurs after a period where the background shows clear signs of distribution, it is no longer a shake-out. It is a genuine breakdown. The "smart money" has already offloaded their positions, support has been withdrawn, and the market is collapsing.
4. Avoiding the Traps
The distractors in this question prey on amateur chart-reading habits. Many traders mistakenly believe a shake-out is defined purely by whether it happens on high or low volume, or if the bar closes near its absolute lows. While volume and the close are important secondary indicators, the ultimate deciding factor between a manipulation tactic (shake-out) and a structural collapse (breakdown) is always the preceding background context.
Stack reps. Stay sharp.
Get KomFi.
https://t.co/dmtmE4o15p
#technicalanalysis #trading #hedgefund #orderflow
Volume Spread Analysis Bearish Setup Question - Background: An index shows distribution. Stock C refuses to rally when the index moves up, instead producing 'No Demand' bars. What is the most likely outcome for Stock C?
Caption:
The Answer: It is a prime candidate for a short position when the index turns down.
Here is the VSA breakdown for why this is a classic bearish setup:
1. Identify the Relative Weakness
In VSA, the market (the index) dictates the flow. When the index rallies but Stock C refuses to follow, the stock is displaying "relative weakness." This indicates that institutional buyers are not participating, or worse, are actively distributing their holdings into the rallies.
2. Interpret the "No Demand" Bars
The key here is the "No Demand" bars during a rally attempt. In professional trading, this tells us there is zero volume-based buying interest at these higher prices. When you have distribution in the background combined with a lack of demand on price spikes, the setup is inherently bearish.
3. The Thesis for the Short
The rule of thumb in VSA is simple: weakness in strength rarely resolves to the upside. Because the stock has already shown it cannot hold its own when the market is strong, it is almost guaranteed to be among the first to collapse when the broader market index loses its support and turns south.
4. Busting the Traps
The "Catch Up" Trap: Many retail traders assume that if a stock hasn't moved yet, it’s "due" to rally. This is a fallacy. In VSA, failure to rally is a negative signal, not a lagging one.
The "Absorption" Trap: Absorption volume occurs when professionals are buying large blocks of stock near the lows, essentially "absorbing" the supply. The video prompt explicitly states the background is distribution, which is the exact opposite of accumulation.
Professional traders don't trade what they want to happen; they trade the imbalance of supply and demand.
Get KomFi!
https://t.co/dmtmE4o15p
#vsa #volumeanalysis #Trading #hedgefund #technicalanalysis
Stop doomscrolling. Turn brutal study hours into addictive progress. Get KomFi.
Most test prep is a static, one-size-fits-all trap that costs $500+ and locks you into a single exam. Guessing correctly on an untimed, average question doesn't give you an edge. You need to train at the absolute limit of your ability.
Meet the Engine. KomFi is education's new operating system. The KomFi Adaptive Testing Engine is designed to find your exact weak spots and bend your mastery curve up and to the right.
The Arsenal:
Over 50,000 institutional-grade questions, 20,000+ flashcards, and 20+ topics covering everything from the GMAT and LSAT to high-finance and Volume Spread Analysis.
The Engine:
Dynamic Calibration: The algorithm calibrates to exactly where you are, then climbs. Every single question is tuned to the edge of your ability.
Advanced Insights: Algorithmic weak-area detection reads every answer and forces you to drill exactly where it counts, ensuring your time is spent compounding your progress, not repeating what you already know.
Zero-Latency Sprints: Take your time back. Run rapid, offline-capable practice sessions that fit perfectly into your commute or the 10 minutes between meetings.
Legacy prep charges you hundreds for a static checklist. KomFi gives you your first 50 questions in every single topic for free—over 1,000 institutional-grade questions to start, with zero paywalls.
Stop training for the average. Train on an engine built for you.
Hit the link in our bio to run your first session.
#GMATPrep #LSATPrep #IBInterviewPrep
Just dipped into 59K!! This is a reach into previous lows
So far a nice little scoop reaction from the lows - but it is spending more time in them than we did back in FEB
One step at a time 👀
#Bitcoin
$BTC
On the 12th May a negative energetic force entered the crypto market. That told us that the two ltf neutral cycle components would set a downtrend.
We can also see the lows at 67k were range bound suggesting balance in the market place. Of course price can never be truly balanced, but it took a long time for bulls to push higher and reject from the first level of resistance and now you can see balance/ value gets sliced apart because there is no force inside balance.
Yesterday afternoon in DC I pointed out the 1:1 sits at 50k (I am not calling for that as I am not into predictions) and that sits external to value.
This is a game of force and structure. The structure was weak and the negative force is strong and this is the result.
Rally attempts in this weekly phase are likely to fail until the weekly is satisfied aka it hits a force strong enough to stop and turn the asset.
And that was all explained on last week's video and now we have some very good data.
My work here is done 🤝
Bitcoin (Update)
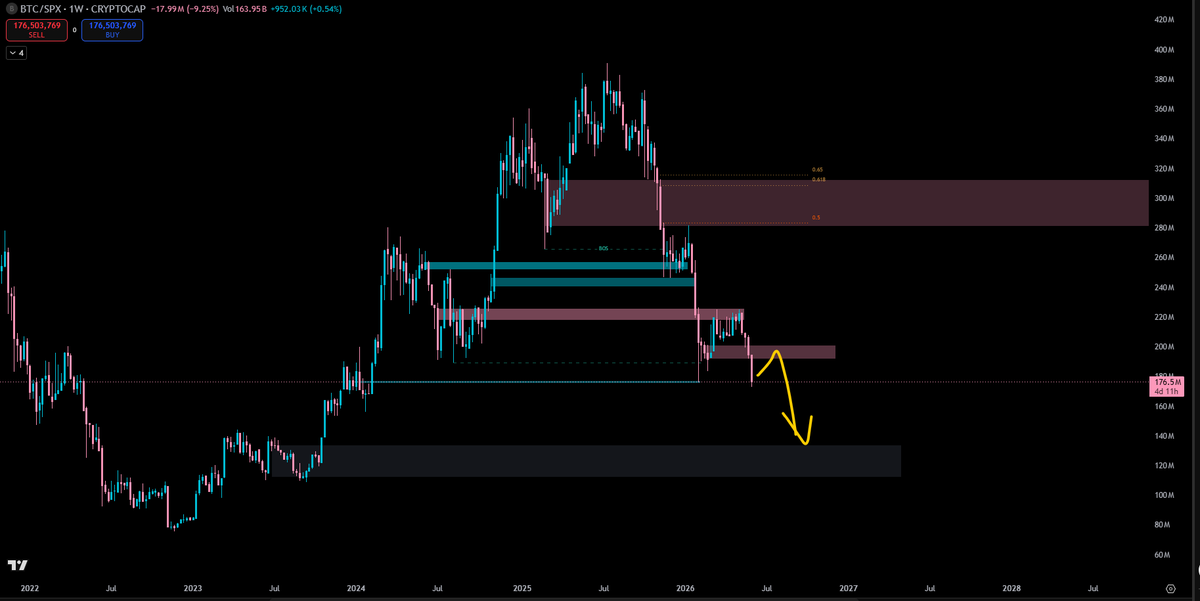
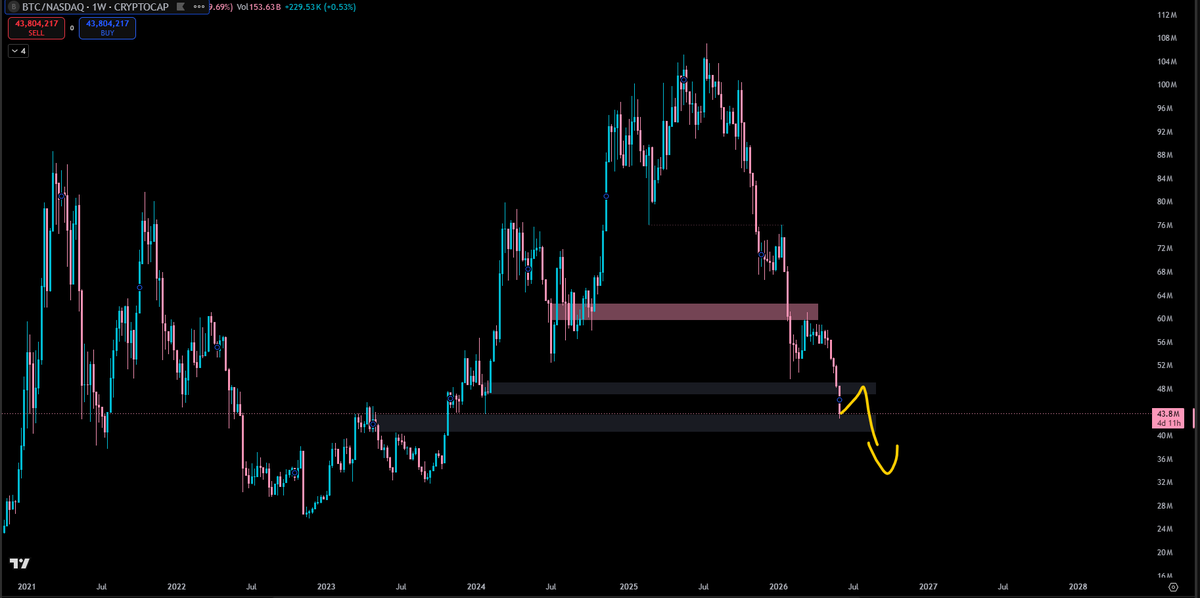
LVN had the work done on the BTC top but target was a bit shy but if you look at BTC/SPX and BTC/NAS they both took big key levels.
Unfortunately I didn't size enough swing shorts (I only have 1 on BTC as a wide stop and always looking for continuations) but I was able to sell 70% of my spot.
Ever since BTC closed below 74.8k, that was the first warning sign and I did say in that last update that there is no demand when it's grinding like that so once the structure loses (in this case, close below 74.8k) its gonna be fast.
I am attempting my first long here on BTC near the extreme range lows and I will be adding if we close the weekly within. For now small risk and I will target near 72k and take a short there.
July is approaching fast and that is the phase I am the most focused on. I really think we get sub 46k BTC. Time will tell
BTC/SPX and BTC/NAS for reference. That is why BTC is underperforming compared to the stock market.
Note that I don't really detail those charts because they are for me a reference and so I only check them with my eyes mostly.
$BTC
Sitting in the 1D Supply block from Feb 2nd. We want to see a reclaim of the VAH of the move down from $98K around ~$77.5K for continuation higher. MTF (4H) and HTF (1D) orderbooks again looking constructive for relief, pending a brief push lower. Leverage players have withdrawn support from orderbooks on the 4H while real-money spot continues to absorb selling. Sellers have work to do here, otherwise the path of least resistance looks higher again here.
$BTC
MTF Bullish 3 Drives into demand while seeing absorption around $65K. Sellers have work to do to break $65K if happening, which will open the door to $63K, then sweeping $60K. For now orderbooks are looking constructive for relief.
✍️ AMT rules I use for my trades:
• Acceptance above VAL/below VAH price will likely migrate toward the opposite boundary of volume (VAH/VAL) using the POC as “reload” area for continuation
• Acceptance above VAH usually signals repricing and continuation, rejection above VAH usually leads back into value because the auction failed to establish higher prices as fair value
• Failed auctions at distribution extremes often lead to aggressive rotations back through the profile (with high statistical probability) -> the bigger the extremes, the higher the probability
• Rejection from low volume areas usually brings price back toward high volume and fair value because low volume zones represent price levels where the market previously found little acceptance
• If the market cannot build acceptance above a level, the breakout is often just trapped inventory created by late buyers entering into poor auction locations
• A POC that keeps attracting price during trend usually confirms the “true business” and accumulation rather than exhaustion
• The longer the market balances inside value, the more meaningful the eventual expansion becomes once acceptance is established outside the range
• Consecutive higher value areas and higher POCs often reveal institutional acceptance of higher prices before trend continuation becomes obvious on the chart
• Alignment with COT makes the AMT trade/setup more reliable giving it a +1
⚠️ Decoding Moneytaur ⚠️
The BCHUSDT chart was chosen.
🔸The setup idea was to trade a breakout into the Monthly Partial Breakerblock at 520.
🔸As a primary continuation level, one can use the MTF (11H + 2H + ...) order blocks. However, to increase the RR, rather than targeting the MTF OB itself, one can target potential price wicks into the LTF OB below, within the MTF wick.
🔸Going into the lower timeframe, the first LTF order block is a 15 minute order block.
🔸To refine it even further, one can go into the timeframes between 2 and 7 minutes to find order blocks hidden between two FVGs. This refined level also aligns perfectly with the previous S/R level and is nearby the EQ of the 15-minute order block.
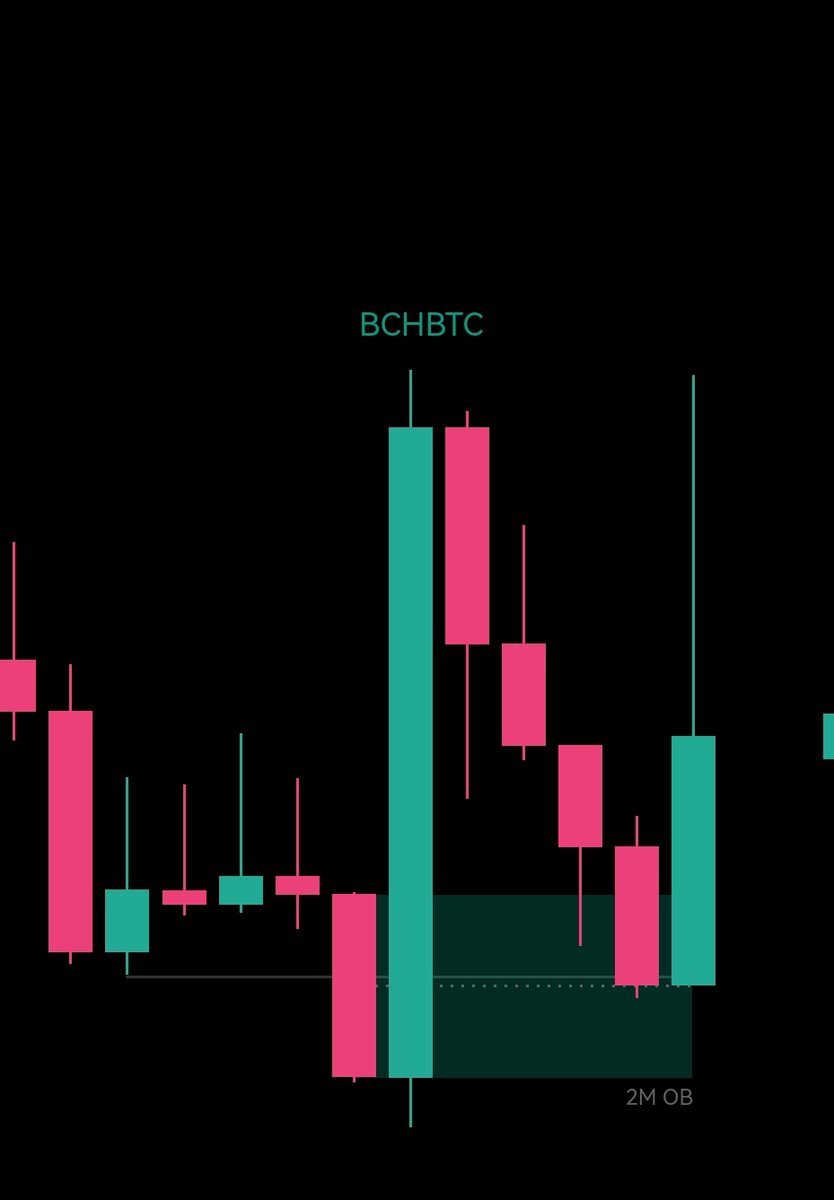
🔸Now, some might ask why MT would long a level in premium. When looking at confluence charts, such as the BCHBTC chart, one can see that price was within a 2M order block during this breakout. He probably used this as additional confluence for the breakout.
If you enjoyed this Post:
1. Like and RT
2. Follow me @OverlordEins for more
If you have any questions put them in the comments below👇