When we're at this part of the market cycle there will be people laughing at you for investing.
Next year you will get to laugh at them.
#Bitcoin#Crypto#trading $BTC
Just as a reminder to all of us. No matter how brutal the market is right now, hold on tight.
Based on the 4-year cycle, which has played out in the last 3 cycles, the cycle bottom is around September-November, just 3-5 months away.
We're past the halfway mark of the bear market. WAGMI!
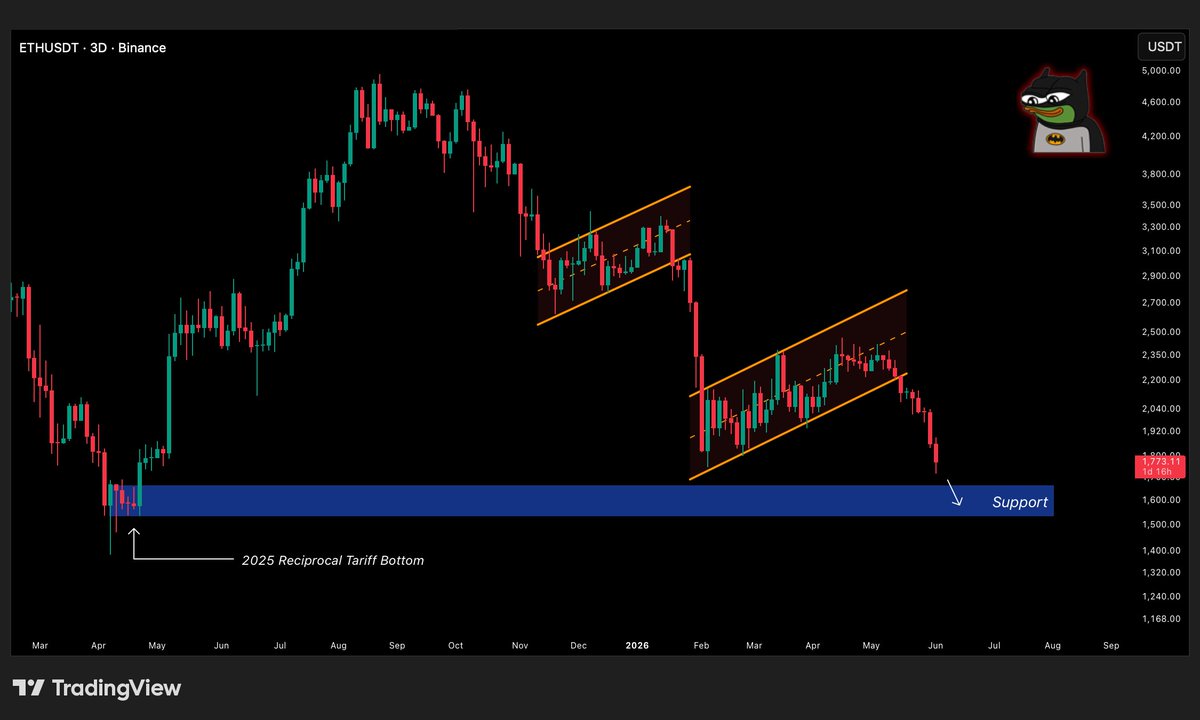
There we go, the bearish flag pattern I marked on $ETH is playing out. And I don't think it's done yet.
However, the good news is that a strong support level is near at $1,600, which marked last year's reciprocal tariff bottom.
Bitcoin has changed how money works.
It even allows companies like Strategy, one of the largest corporate Bitcoin holders in the world, to offer an 11.50% dividend yield through its preferred stock, STRC.
The model is simple: raise capital through equity, convertible notes, and preferred stock, then use the proceeds to buy BTC. The 3.3x BTC coverage ratio means Strategy holds enough Bitcoin to cover STRC notional 3.3x over, giving preferred holders a cushion in any drawdown.
But this only works as long as BTC appreciates and capital markets stay open. If BTC drops hard and markets freeze, that dividend becomes very difficult to sustain.
STRC is essentially a leveraged BTC credit instrument dressed as a yield product. The 11.50% yield is the market pricing in exactly that risk.
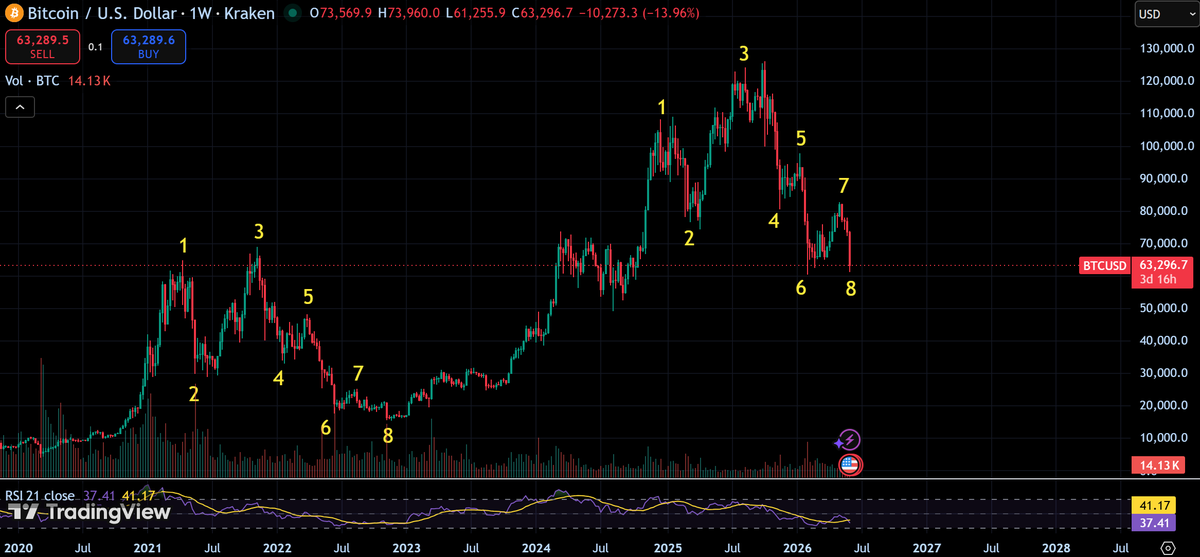
Bitcoin has done this before. Almost exactly.
Two full Bitcoin cycles mapped side by side. Eight structural pivot points. Nearly identical sequence.
What stands out is the compression. Cycle 1 ran 2,200% and dropped 77%. Cycle 2 delivered 620% and is currently down 50% from its peak. The upside shrunk. So did the downside. That is what happens when an asset matures and deeper capital enters the market.
If the structural analogy holds, point 8 corresponds to the same exhaustion zone that marked the 2022 bottom. Mapping the proportional drawdown from this cycle's peak suggests a likely bottom somewhere in the $54,000 to $55,000 range before the next leg up begins. Weekly RSI in the high 30s to low 40s is consistent with where capitulation phases have historically resolved.
The pattern has played out once already. Now it is playing out again.
The analysis also aligns with the Bitcoin MVRV score.
Historically, since the first cycle, $BTC bear markets have always bottomed out at around 0 to -0.4.
For context, we're currently at 0.42.
Hence, a lower low in price action might be needed for BTC to reach that bear market bottom level.
Might sound scary, but to me, it's an opportunity to buy Bitcoin at the cheapest price in the past 2-3 years.
As we all know, SpaceX, Elons Musk's company is going public soon.
It's about to become the largest IPO in history, but I don't think anyone is pricing the risk that comes with it.
the targeted offering is $75 billion at a valuation north of $1.8 trillion. That blows past the old record.
Aramco raised $38 billion back in 2019, and remember, Aramco is the single most profitable company on the planet, roughly $350 billion in net profit last year.
SpaceX is set to raise nearly double that, and it doesn't print a fraction of those earnings.
Why does it matter?
A company like this gets absorbed into the major indices, and the moment it does, every passive fund tracking the S&P 500, the Nasdaq 100, the Russell 1000 is forced to buy it.
That is something as a concentration risk. A single name, instantly one of the heaviest weights in the index.
Here is the part most people miss.
When one stock carries that much index weight, the whole market becomes hostage to it.
If SpaceX stumbles, the passive machine that was forced to buy on the way up becomes a forced seller on the way down. A wobble in the most crowded mega-cap in the index doesn't stay contained in equities.
It pulls capital out of the entire risky asset complex, including Bitcoin.
$BTC sits at the far end of that risk curve. When the index heavyweights crack and global risk appetite drains, Bitcoin will get affected as well.
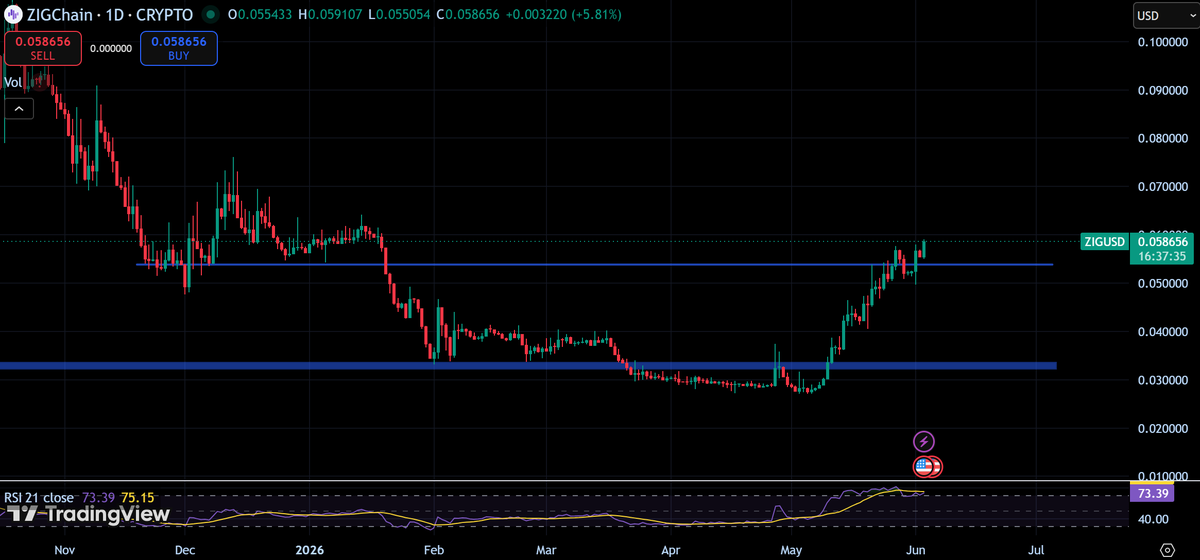
ethereum:0xb2617246d0c6c0087f18703d576831899ca94f01 is saving my portfolio right now.
While everything is crashing, it's up 103% in the last month, 11% on the week, and another 5% today.
What a beast.
It seems the AI meta is not just running through the stock market. AI coins like $FET, $RNDR, and $NEAR are taking the bid as well.
Here's FET's price action as an example.
Price has just broken out of its strong bearish FVG, forming a cup and handle. Good chance we're going to see further continuation in this theme.
$MSFT is up +18% from my analysis, a good little portfolio diversification play. Here's what I think of it next.
Price has broken out of its strong resistance, turning it into support. That area is one to watch out for during the next retracement.
Heads up, the week ahead is going to be a volatile one for global assets.
PMIs, NFPs, and CPIs are all stacked up against one another.
Even today, we get a glimpse of the US job market.
The Fed is waiting on these indicators to see how inflation is being affected by rising energy prices.
All of this feeds into interest rates and policy decisions, a key driver of global liquidity, from the biggest and most influential central bank in the world.
When everything was dumping, $BNB jumped +16% to its high.
This might be a good time to start buying the dip, as price retraces back to its resistance-turned-support.
Impressive from BNB, considering how harsh the market conditions have been.