MACRO STOCK MARKET FORECAST:
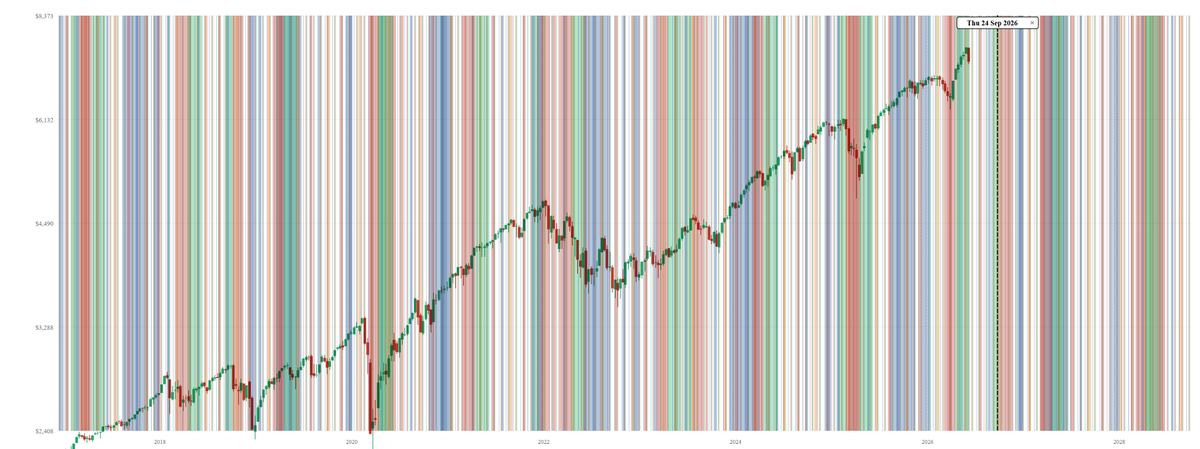
We will have another massive $SPY $SPX dump on sept 23, 2026.
Red is bearish, green is top, blue is new bullish trend. Darker means more powerful.
For daily scalping and 0DTE trades, you gotta click that subscribe button. Building these prediction algorithms ain't cheap.
HOLY. FUCKING. SHIT.
You know those terrifying charts that show how "right now" looks sorta like some scary time in the past? Well, this one is a fucking doozy.
The blue line below is the most recent 67 days. The red line is statistically the single most similar 67 day period in stock market history...early Summer 1929. I shit you fucking not.
And you're thinking..."hey, we still have time until it peaked back then." Sure do. And when does that 1929 peak correspond to 2026?
How about *exactly* July OpEx (7/17/26).
HELP ME, ODDSTATS. I'M SCARED AND I DON'T KNOW WHAT TO DO.
Panic. That's what. Freak the absolute fuck out and sell everything. Buy as many puts as you can.
Be afraid, be very afraid.
They're heeee-ere.
Just when you thought it was safe to go back into the water.
You'll believe an elephant can fly.
But seriously, remember that as scary as this is, 1929 was very different from today. Only men were allowed to trade stocks then. Electricity and the female orgasm hadn't even been invented yet.
We'll probably be fine this time. Maybe.
I wanted to be a stock market quant. I was always good at math but after years of research, I realized that really smart guys did all the heavy lifting already. All I had to do is compare the right end result data against some other data that was the results of some other super smart guy calculations.
This chart is that.
This is all the most complex calculations in the most easy to compare fashion.
Use it and enjoy it. It helps you predict the future of the stock market and get rich.
April Weaker in Midterm Election Years
As you can see in the chart of the recent 21-year $QQQ $IWM $SPY $DIA performance in April and midterm-election years since 1950, the month has been nearly perfect over the last 21 years with gains steadily building from the first trading day to the last with only the occasional and minor blip along the way.
In midterm-election years, the market has generally been strong until around mid-April but noticeably weaker in the second half. This is when the “Weak Spot” (page 46 STA 2026) of the 4-year presidential election cycle has historically begun.
Stay Ahead with Almanac Investor Get the 2026 Stock Trader’s Almanac FREE https://t.co/gUYSN5yKVw
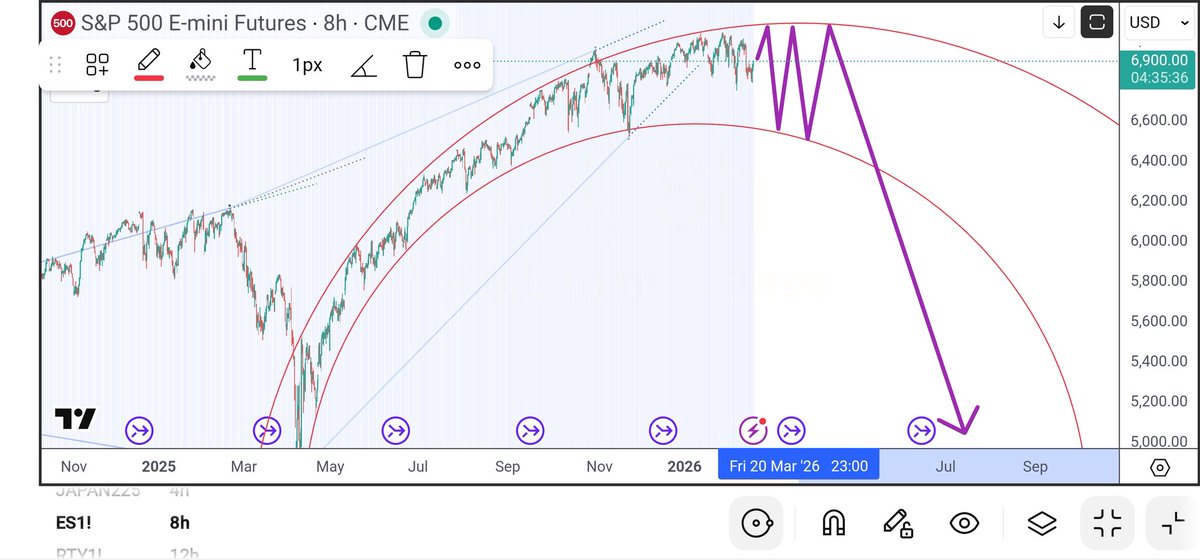
Here's a reminder of what's going to happen. This is a broadening arc channel. If you want to get the exact trades longs and shorts 23 hours a day for the S&P 500 futures market and for buying options calls and puts, there's a link in my profile. You get real-time analysis and trades.
Tax-loss selling and yearend portfolio restructuring can weigh on first half December performance. Second half is stronger with Santa Claus Rally kicking off on Christmas Eve day. https://t.co/iE9c2NT3bI