[Partner's perks spotlight] Early stage startups affiliated with #AWS#Activate Provider #roiquant can apply to redeem the USD $5,000 or USD $10,000 AWS Activate #credits as #perks to experiment, build, and #grow with AWS at $0 cost. 🤩
"We propose an algorithm to capture emergent patterns in the cross-correlations of financial markets, highlighting regime changes on a global scale... [It] combines detrended cross-correlation cost analysis and the minimum-spanning-tree filtering approach." https://t.co/govtlT2RZC
𝗔𝗣𝗜 𝗚𝗮𝘁𝗲��𝗮𝘆 𝘃𝘀 𝗟𝗼𝗮𝗱 𝗕𝗮𝗹𝗮𝗻𝗰𝗲𝗿 𝘃𝘀 𝗥𝗲𝘃𝗲𝗿𝘀𝗲 𝗣𝗿𝗼𝘅𝘆
Regarding a system design, we often need clarification about the roles of a Load Balancer and an API Gateway. Most of our resources are about their implementation rather than real-life use cases.
🔹 𝗔𝗣𝗜 𝗚𝗮𝘁𝗲𝘄𝗮𝘆 sits between a client and a group of backend services. It performs the function of a reverse proxy by accepting all application programming interface (API) calls, aggregating the different services needed to fulfill them, and returning the right outcome. 𝗨𝘀𝗲𝗿 𝗮𝘂𝘁𝗵𝗲𝗻𝘁𝗶𝗰𝗮𝘁𝗶𝗼𝗻, 𝗿𝗮𝘁𝗲 𝗹𝗶𝗺𝗶𝘁𝘀, 𝗮𝗻𝗱 𝘀𝘁𝗮𝘁𝗶𝘀𝘁𝗶𝗰𝘀 are typical duties that API gateways take care of on behalf of a system of API services. Also, the API gateway can handle faults (circuit breaker) and log and monitor.
🔹 𝗟𝗼𝗮𝗱 𝗕𝗮𝗹𝗮𝗻𝗰𝗲𝗿 is a service that distributes incoming traffic across many servers or resources. Usually, we have two or more web servers on the backend, and it 𝗱𝗶𝘀𝘁𝗿𝗶𝗯𝘂𝘁𝗲𝘀 𝗻𝗲𝘁𝘄𝗼𝗿𝗸 𝘁𝗿𝗮𝗳𝗳𝗶𝗰 𝗯𝗲𝘁𝘄𝗲𝗲𝗻 𝘁𝗵𝗲𝗺. Its primary purpose is to use resources optimally. A more equal task allocation and increased capacity can enhance the system's responsiveness and reliability. There are three high-level load balancers: hardware-based, cloud-based, and software-based.
🔹 𝗥𝗲𝘃𝗲𝗿𝘀𝗲 𝗣𝗿𝗼𝘅𝘆 server resides in front of backend servers and transfers client requests to these servers. Reverse proxies are typically used to increase security, speed, and dependability. A reverse proxy receives a request from a client, forwards it to another server, and then returns it to the client, giving the impression that the first proxy server handled the request. These proxies ensure that users don't access the origin server directly, giving the web server anonymity. They are usually used for Load balancing, where we need to deal with incoming traffic flow so that we may distribute that traffic between multiple backend servers or use them for caching.
So, the main thing that differs these two is that an 𝗔𝗣𝗜 𝗚𝗮𝘁𝗲𝘄𝗮𝘆 𝗶𝘀 𝗳𝗼𝗰𝘂𝘀𝗲𝗱 𝗼𝗻 𝗿𝗼𝘂𝘁𝗶𝗻𝗴 𝗿𝗲𝗾𝘂𝗲𝘀𝘁𝘀 to the appropriate service and it handles requests for APIs, while a 𝗟𝗼𝗮𝗱 𝗯𝗮𝗹𝗮𝗻𝗰𝗲𝗿 𝗶𝘀 𝗳𝗼𝗰𝘂𝘀𝗲𝗱 𝗼𝗻 𝗱𝗶𝘀𝘁𝗿𝗶𝗯𝘂𝘁𝗶𝗻𝗴 𝗿𝗲𝗾𝘂𝗲𝘀𝘁𝘀 𝗲𝘃𝗲𝗻𝗹𝘆 between a group of servers and handles requests that are sent to a single IP address, which works at protocol or socket level (TCP, HTTP).
Some 𝗲𝘅𝗮𝗺𝗽𝗹𝗲𝘀 of API Gateways are Amazon API Gateway, Ocelot (.NET-based), Tyk, or Apache APISIX, while Load Balancers are Azure Load Balancer, HAProxy, or Seesaw.
An example of reverse proxy services is 𝗔𝗽𝗮𝗰𝗵𝗲 𝗣𝗿𝗼𝘅𝘆, 𝗡𝗴𝗶𝗻𝘅 𝗼𝗿 𝗜𝗜𝗦 with additional modules (Url Rewrite).
#programming #api
How is data sent over the internet? What does that have to do with the OSI model? How does TCP/IP fit into this?
7 Layers in the OSI model are:
1. Physical Layer
2. Data Link Layer
3. Network Layer
4. Transport Layer
5. Session Layer
6. Presentation Layer
7. Application Layer
--
Subscribe to our weekly newsletter to get a Free System Design PDF (158 pages): https://t.co/FIzCeaWsZV
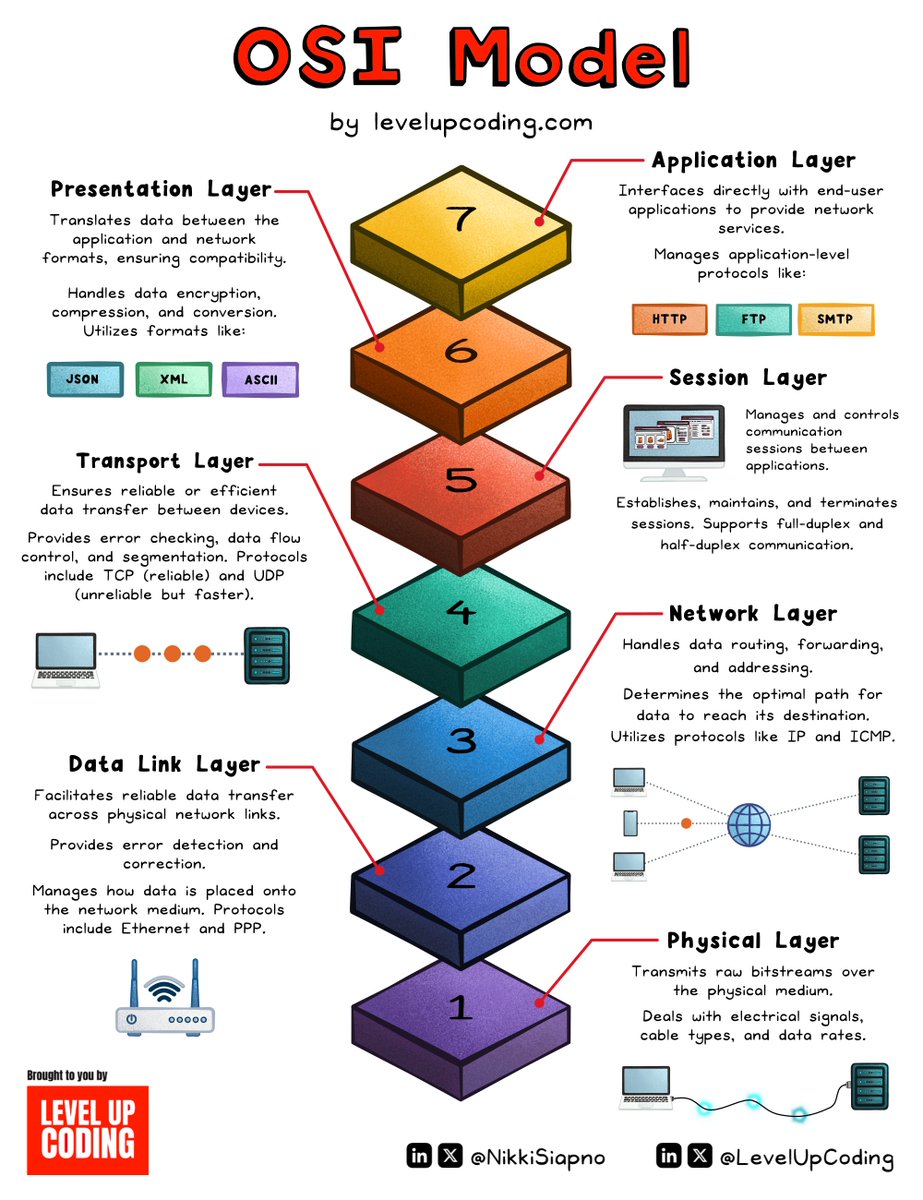
Concepts every developer should know/be aware of: OSI model.
The OSI model is a fundamental framework for understanding how network interactions occur.
It comprises seven distinct layers, each with its own roles and responsibilities, working together to facilitate communication across diverse systems and devices.
Application layer (layer 7)
Interfaces directly with end-user applications to provide network services.
It manages application-level protocols like HTTP, FTP, and SMTP, which enable services such as web browsing and email.
Presentation layer (layer 6)
Translates data between network and application formats. It manages data encryption, compression, and formatting.
It maintains system interoperability by ensuring data is readable by both the sender and the recipient.
Session layer (layer 5)
This layer manages the creation, maintenance, and termination of communication sessions between applications for efficient data transfer.
Supports full-duplex and half-duplex communication to ensure proper sequencing and coordination in multi-way exchanges.
Transport layer (layer 4)
It coordinates end-to-end communication by delivering data to the correct application through ports, using either reliable delivery (TCP) or unreliable but faster methods (UDP).
Error checking, flow control, and segmentation are used in the transport layer to achieve reliable data transfer.
Network layer (layer 3)
Handles data routing, forwarding and addressing, determining the optimal path for data to reach its destination using protocols like IP and ICMP.
Data link layer (layer 2)
Facilitates reliable data transfer across physical network links.
Provides error detection and correction. Manages how data is placed onto the network medium. Uses protocols like Ethernet and PPP.
Physical layer (layer 1)
This layer forms the foundation of the OSI model, converting raw bitstreams into signals for transmission over physical media.
It defines the hardware specifications for transmission, including the types of physical media that can be used, such as cables and wireless.
It deals with electrical signals, cable types, and data rates.
The OSI model is grounded in principles that support structured and predictable data movement.
Each layer operates independently, simplifying design and troubleshooting.
Data is encapsulated with headers as it moves down the layers and decapsulated as it ascends, preserving information integrity.
By standardizing communication, this framework promotes system interoperability and supports global data exchange.
~~
Thank you to our partner Postman who keeps our content free to the community.
If you're running API tests or ready to start, Postman collections are widely regarded as the go-to solution: https://t.co/6XEKNElUHn
🚨BREAKING: The @Stanford Institute for Human-Centered AI publishes its Artificial Intelligence Index Report 2024, one of the most authoritative sources for data and insights on AI. Below are its top 10 takeaways:
1. AI beats humans on some tasks, but not on all;
2. Industry continues to dominate frontier AI research;
3. Frontier models get way more expensive;
4. The United States leads China, the EU, and the U.K. as the leading source of top AI models;
5. Robust and standardized evaluations for LLM responsibility are seriously lacking;
6. Generative AI investment skyrockets;
7. The data is in: AI makes workers more productive and leads to higher quality work;
8. Scientific progress accelerates even further, thanks to AI;
9. The number of AI regulations in the United States sharply increases;
10. People across the globe are more cognizant of AI’s potential impact—and more nervous.
➡️Read the @StanfordHAI report below.
➡️For more information on AI policy & regulation, subscribe to my newsletter (link in bio).
At my first startup, it took us 15 months and multiple pivots to find our PMF and ship a good v1 product. If we hadn't pivoted, we would have died.
3 mistakes we made 👇
1) Being too far ahead of the customer's current problems.
Our assumption: Everyone would be moving to the cloud in 2-3 years and would need a cloud monitoring solution. The reality was that it was a much longer timeline and there's no funding for being right eventually.
Our pivot: Fixed our product so that it could be used even if a company wasn't on the cloud yet.
2) Asking too much from our customers.
Our assumption: We thought our software would operate as SaaS, which meant that customers would have to adjust their approach to be compatible with our tech. But customers were telling us the opposite: they needed the entire solution to be on premise.
Our pivot: Modified our platform so that companies didn't have to make any changes in application architecture to use our software. They brought their existing applications, and we would set them up.
3) Trying too hard to sell our products instead of solving customer problems.
Our assumption: We were designing a complex product that would manage the entire monitoring process — from finding to fixing issues. So that's what we kept selling. But customers only wanted the "find it" part. Our product would have been excessive.
Our pivot: Cut back on our product roadmap and focused on simple application visibility.
The hardest test for any startup is to find initial PMF. Finding it requires countless customer conversations and adjusting based on the feedback you get.
When you run a company, it's always on your mind...
The best CEOs never stop - just adjust how they use their time and when
Jamie Dimon on when he does his deep thinking - Sundays
from his Annual Letter to Shareholders, a must read as always:
https://t.co/kkAEL2iICp
If your #DataScience does not impact the decision, you do not add value!
This is what I tell my students. So after an entire course of building #spatial uncertainty models, today we will learn how to make #decisions in the presence of #uncertainty.
To help my students, I built out this #Python @matplotlib dashboard for optimum decision making and shared it on #GitHub @ https://t.co/cfytv9xXAP ∀.
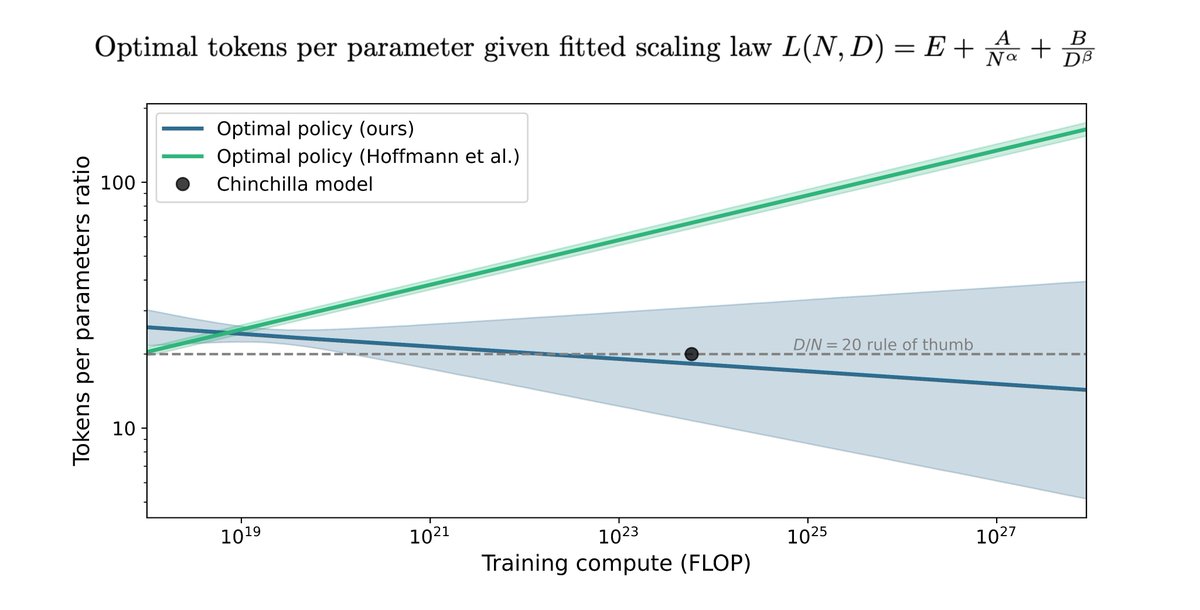
The Chinchilla scaling paper by Hoffmann et al. has been highly influential in the language modeling community. We tried to replicate a key part of their work and discovered discrepancies. Here's what we found. (1/9)
A common enterprise use of #LLMs is in RAG (Retrieval Augmented Generation) applications on an organization's own custom #KnowledgeBase. These are difficult to put in production. @AbacusAI#GenerativeAI handles it all for you. See how in the thread below:
https://t.co/VtNg5YwOSU
Hey, I've published an extensive introduction on how to apply a Principal Component Analysis (PCA) using the R programming language: https://t.co/qPhLBATegE
#datascienceeducation#RStats#RStudio#Statistics
Video tutorial: Macro-quantamental indicators
An introduction to the current industry standard (JPMaQS). Free trials for institutional investors via J.P. Morgan. Special targeted access for academic research.
https://t.co/F7YHCToOUp [https://t.co/G9A6mrQuoT]
Kaggle has top-notch tutorials. I find it surprising that most people aren't aware of these.
I usually recommend their intro and intermediate courses to Machine Learning because they start slowly and are really easy to follow.
They are great to open people's appetite for more!
Fraud Detection is a business problem that can be solved with data science. In 2 minutes, I'll break it down and share how to make Python and R fraud detection projects for your target audience. Let’s go!
Fraud detection is a set of activities undertaken to prevent money or property from being obtained through deceitful pretenses.
This process uses analytics that examine behavior to differentiate legitimate actions from potentially fraudulent ones.
Fraud detection is a critical component for many businesses, particularly as online transactions increase and fraudsters become more sophisticated.
Industries sensitive to fraud detection:
1. Banking and Financial Services: Companies like JPMorgan Chase and HSBC use advanced machine learning algorithms to analyze transaction patterns and identify anomalies that may indicate fraud.
2. E-Commerce and Retail: Amazon and Alibaba are prime examples of e-commerce platforms that utilize fraud detection. They implement sophisticated fraud detection engines that analyze purchasing patterns and flag unusual transactions for review.
3. Healthcare: UnitedHealth Group and Pfizer might not be directly involved in fraud detection but are affected significantly by insurance fraud. Healthcare companies use fraud detection systems to monitor claims and detect irregular patterns that suggest fraudulent activities such as billing for services not provided or upcoding.
4. Insurance: Allstate and State Farm use predictive analytics to identify potentially fraudulent claims. They analyze patterns in claim submissions and use historical data to recognize inconsistencies or anomalies.
Solving fraud and fraud detection is the chief responsibility of the Data Science team.
You can see examples in Python code and R code here:
R Code: https://t.co/DvuYPZRFTG
Python Code: https://t.co/GFPp53AwLV
There you have it! Some good ideas to start improving developing Fraud Detection models and design projects for your target audience.
Ready to learn how to solve Business Problems with data science?
I’ve spent 100 hours consolidating my learnings into a free 5-day course, How to Solve Business Problems with Data Science. It comes with:
300+ lines of R and Python code
5 bonus trainings
2 systematic frameworks
1 complete roadmap to avoid mistakes and start solving business problems with data science, TODAY.
👉 Here it is for free: https://t.co/YXG4pL97ZN


![roiquant's tweet photo. [Partner's perks spotlight] Early stage startups affiliated with #AWS #Activate Provider #roiquant can apply to redeem the USD $5,000 or USD $10,000 AWS Activate #credits as #perks to experiment, build, and #grow with AWS at $0 cost. 🤩 https://t.co/6BYlJWnMS6](https://pbs.twimg.com/media/GXS0qfEbgAAuKmY.jpg)


![macro_synergy's tweet photo. "We propose an algorithm to capture emergent patterns in the cross-correlations of financial markets, highlighting regime changes on a global scale... [It] combines detrended cross-correlation cost analysis and the minimum-spanning-tree filtering approach." https://t.co/govtlT2RZC](https://pbs.twimg.com/media/GXQcQwiXYAAHz3R.jpg)


![macro_synergy's tweet photo. Video tutorial: Macro-quantamental indicators
An introduction to the current industry standard (JPMaQS). Free trials for institutional investors via J.P. Morgan. Special targeted access for academic research.
https://t.co/F7YHCToOUp [https://t.co/G9A6mrQuoT] https://t.co/V1uByhGypV](https://pbs.twimg.com/media/GLbaQ-RWYAAW0ix.jpg)


