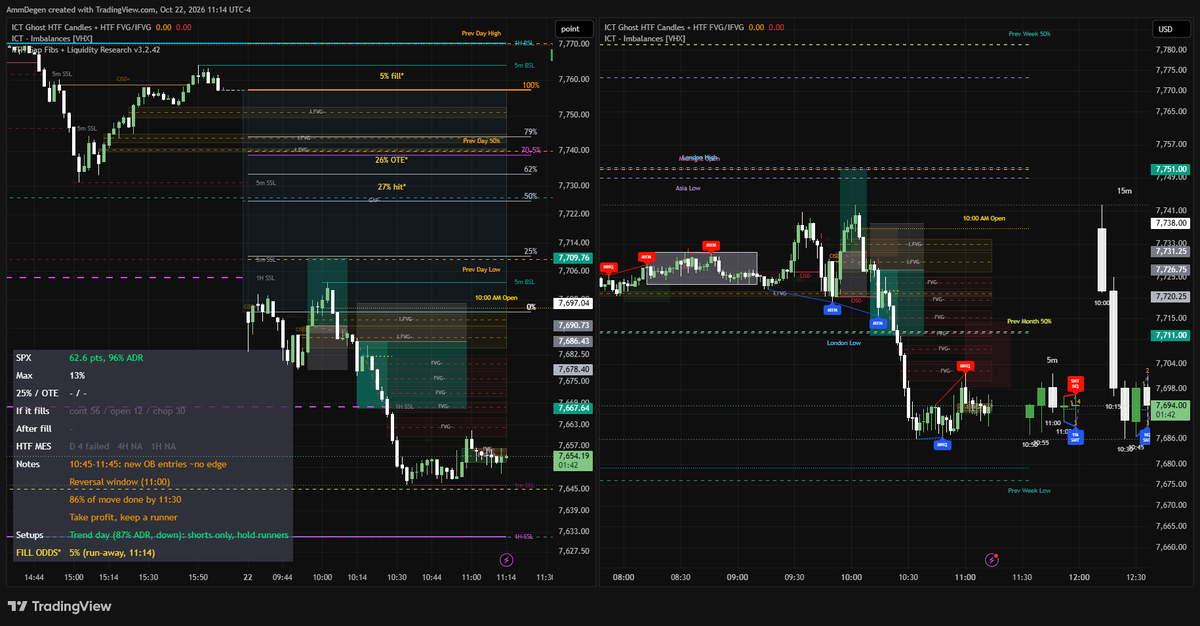
Update: @lanto_trades has his dannystrades moment.
He's not on account #42. He's on account #819.
Quick posted and deleted by Lanto.
This is fraud. Shame on Lanto and all those who enable him.
I would like to see @VestExchange take a hard look at these edited Account Number videos/screenshots. Boot influencers who are deceiving the customerbase. Other firms would do that.
I bucketed every day into low, mid and high volatility using its ADR (known before the open) ranked against the prior 120 sessions. About 850 days each on NDX and SPX, 2024 included.
Same answer in all three. 10:50, 11:50, 13:10 and 15:15 match their shifted windows on range, day high/low, turns and reversals whether the day is quiet or wild.
9:50-10:10 runs about 10% bigger in every regime, but its only fair comparisons sit after it (earlier ones run into the open), so that’s the open cooling off plus the 10:00 data, not the macro.
Side note: the macro and the shifted windows come from the same days, so a day’s volatility can’t fake a macro effect. The split was checking whether one was hiding in a single regime. It isn’t.
The ICT macro windows behave exactly like the same windows shifted 10 to 20 minutes either way.
How I tested it: I took each macro window and compared it with the same-length window slid 10 or 20 minutes earlier or later. That way time of day can’t fake a result: if 10:50-11:10 is special, it should beat 10:40-11:00 and 11:00-11:20. I checked how far price moves in the window, whether the day’s high or low forms there, whether price turns there, and whether the move reverses afterward. That’s NDX and SPX over 4 years (about 700 to 800 days), and MNQ/MES futures this year for London and the 8:50 window.
🧵
After collecting years of data, I'll post some interesting things, before/after sessions. You may find some of it interesting. It's based on NDX and SPX, but can be translated to MNQ and MES.
Data Hit
-The day after a huge down day doesn’t expand again (71-74%). Ranges stayed under 0.8 ADR.
-NDX filled its gap (about 60% pre-open) at 9:44.
-SPX didn’t fill. At about 40% pre-open, no fill was more likely.
👇
Data Missed
-SPX’s path. After a runaway, a gap of that size reaches 80%+ only 14% of the time. SPX ran to 85% before fading. The ending matched the data; the middle of the day didn’t.
-SPX didn’t fill after its post-10:30 OTE. The indicator showed 59-65%.
Data Split
The day after a huge down day closes red (42%). SPX closed red; NDX closed green.
Tough morning of price action for me.
-The first long back into the gap was the right idea.
-Once I got stopped out, I went short because I saw 1 HR SSL that I thought we wanted first, while NDX started to show weakness (SPX was weak all morning).
-I then somewhat revenge-traded the initial idea. The structure and setup all aligned, which is how I'm rationalizing it lol. As you can see, NDX had the clean expansion through the continuation. Was banking on SPX catching up to NDX all day and got burnt a couple of times. Have a great weekend🫡
@scofamine_ I always try to be safer trading back into the gap when I’m close to the open and don’t expect a deep retracement. Nice trade though🙏🏻🫱🏻🫲🏼
SPX today for the win. The first trade was a BE, and the second was a nice short.
-1st long: I was going back into the gap, as I was expecting at minimum a 25% retracement, hopefully 50%.
-Due to how much time decays the chances of fib levels being hit, by 10 AM I started shifting my bias short. Just needed confirmation.
-10:04 offered a bearish OB on both NDX and SPX, so I took it short and got a sniper entry. Was willing to risk due to tight SL
-Jeeted when we cleared lows and realized I was an idiot, so got back in on continuation.
Thank you, @LumiTraders, for bringing a novel trading approach to the space. A true pioneer!🙏
What is real:
Time of day. The first hour and the 10:00 window are busy, midday is quiet, and the last hour makes about 13% of the day’s highs and lows. The 9:50 macro looks active only because it sits inside the 10:00 window, and so does the window next to it.
The reversals study found turns cluster in the :00 and :30 candles, where hourly and half-hour candles close and open. That’s a real effect, and it’s broader than the macro windows: any :00 or :30, not specific 20-minute slots.
--9:50-10:10: day’s high or low forms inside 17% of the time, vs 13 to 15% when shifted. Reverses after 48% of the time.
10:50-11:10: day’s high or low forms inside 6% of the time, vs 6 to 9% when shifted. Reverses after 51% of the time.
-11:50-12:10: day’s high or low forms inside 5% of the time, vs 5 to 6% when shifted. Reverses after 50% of the time.
-13:10-13:40: day’s high or low forms inside 7% of the time, vs 6 to 8% when shifted. Reverses after 49% of the time.
-15:15-15:45: day’s high or low forms inside 13% of the time, vs 12 to 15% when shifted. Reverses after 49% of the time.
Where FVGs do earn their place is as the location for your trigger, not as a level that holds on its own:
An order block whose stop sits inside a fresh 2m FVG: about +0.05R at 1.5R.
One whose stop sits inside a fresh 6m FVG: about +0.09R.
Other order blocks: about +0.01R.
Both results are positive in both halves of the data.
Price reacts at FVGs about as often as anywhere else. The edge comes when the reaction is confirmed with a CISD, not from the zone itself.
Why you see it every day:
Any zone holds about half to two-thirds of the time. So you really do see bounces at FVGs most days. You’d see the same bounces at a box drawn anywhere.
Daily zones are wide. “A strong bounce from the exact area” is likely when the area is a few hundred NQ points tall.
Levels stack up. In your screenshot, the 29,000-29,200 inversion also has the previous month low, the previous week low and the August range under it. Something there was likely to react. The IFVG can’t take the credit by itself.
Memory. The three bounces stick. The inversions that got run through get redrawn or forgotten. Your chart shows 3 touches; the test has about 1,000.
13 years of NDX and SPX daily candles and 7 years of MNQ, about 1,000 touches per row on NDX. The touch candle closing back on the right side of the zone was also the same, about 40-50% for real and fake zones alike. And as I found earlier, an untouched daily FVG gets reached as often as a level the same distance away on the other side, so they don’t act as magnets either.
I tested exactly daily FVGs, daily inversions, the 50% line, and 4H FVGs on MNQ futures. Each one was compared with the same zone moved to a random price 1-3 ADR away. If FVGs are real imbalances that price has to respect, the real zones should hold more often than the moved copies.
What happened when price came back to the zone (“held” means price moved away from the zone before a daily close through its far side):