India Is 12 Months Away From Rank 2 in the Global AI Data Center Race
Carnegie ranked the most economically attractive countries to build AI data centers. India is 5th. The gap to the US: just 4.8%.
Here is what the ranking actually measures. Not chips. Not subsidies. Not power tariffs. Speed of execution.
Two numbers tell the whole story:
US loses one year on timelines → drops behind India.
India saves one year → jumps to Rank 2, ahead of Finland, Canada, and the United States.
No new policy. No new capex. No new technology. Just faster approvals, faster land, faster grid connections.
Germany, at -19.4%, sits last. Longest timelines in the world. The capital simply left.
The AI race is a bureaucracy race. India is one speed bump away from winning it.
Innovation pyramid of Indian Biopharma = moving up the value chain
Below Chart Summarizes estimated addition of innovation led revenues in 2035 by each opportunity segment. Bernstein model estimates Rainmakers leading at ~$70-75 Bn while Complex specialty add an additional $ 50-55Bn.
Rupee Depreciation and Market Returns
Risk Signal or Opportunity Signal?
Unlike the general consensus that one should abstain from investing when the rupee depreciates sharply, the data shows that whenever the rupee has depreciated by ~15% or more, an investment in the broader market, represented by the Nifty 500 TRI, has ended up delivering above-average returns over the next 1, 3, and 5 years.
source : valuemetrics
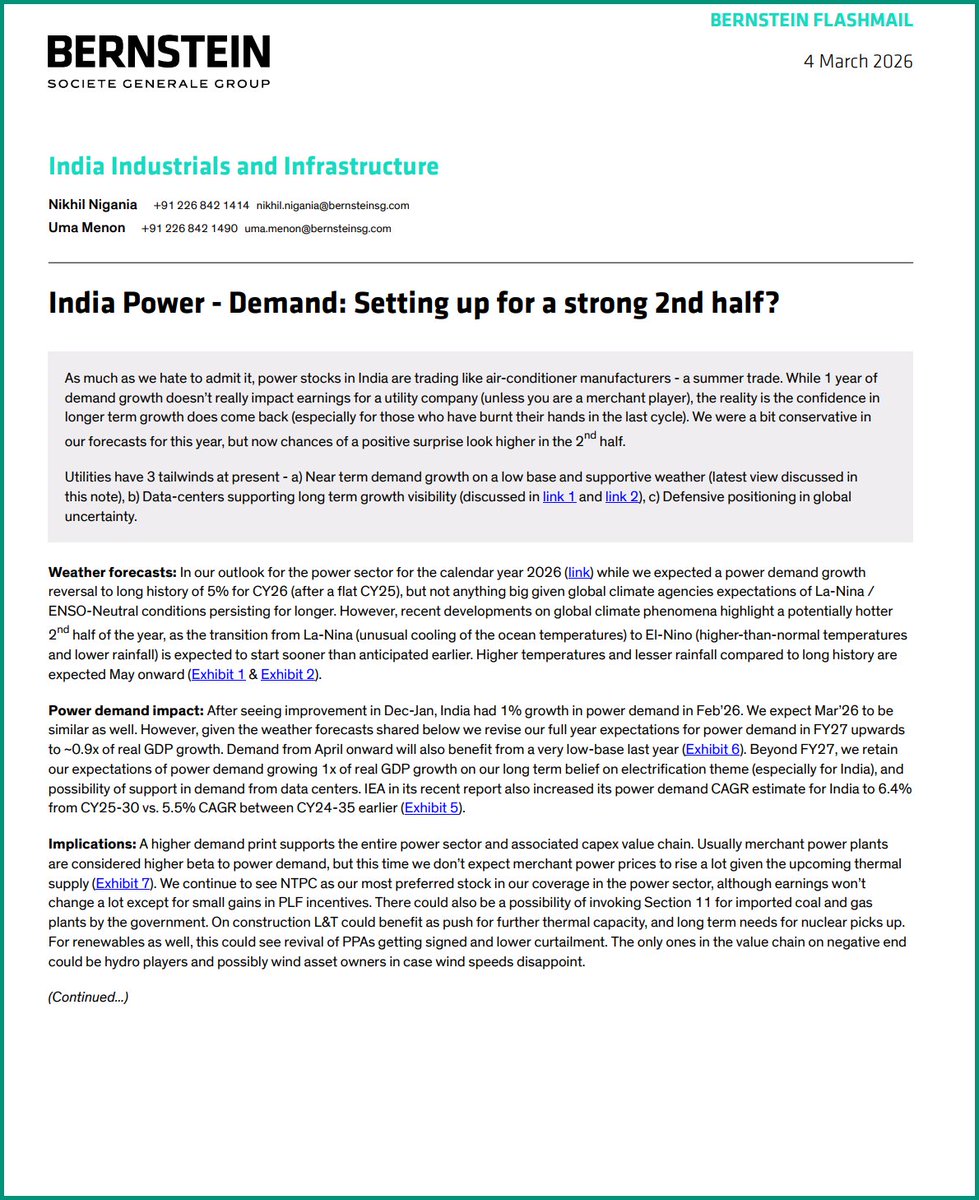
Bernstein || India Power - Demand: Setting up for a strong 2nd half?
Utilities have 3 tailwinds at present
- a) Near term demand growth on a low base and supportive weather (latest view discussed in this note),
b) Data-centers supporting long term growth visibility,
c) Defensive positioning in global uncertainty
POWER DEMAND
CLSA || Korea: Pros and cons of profit taking
KOSPI >5000. Where next..?
The KOSPI is up YoY by 116% (or by 131% from 9 April). On just two prior occasions since 1980 has this momentum been exceeded (1987 and 1999). Investors will rightly be considering booking at least some profits. While technical, valuation, and AI overinvestment concerns may prompt lowering exposure, an extended tech cycle, positive earnings revisions, value creation and the domestic recovery afford evidence to stay.
Our 2026 theme is “Rotation” as the AI trade reaches exhaustion. In this spirit, we believe it prudent to top slice our 20% overweight, reducing to 15%.
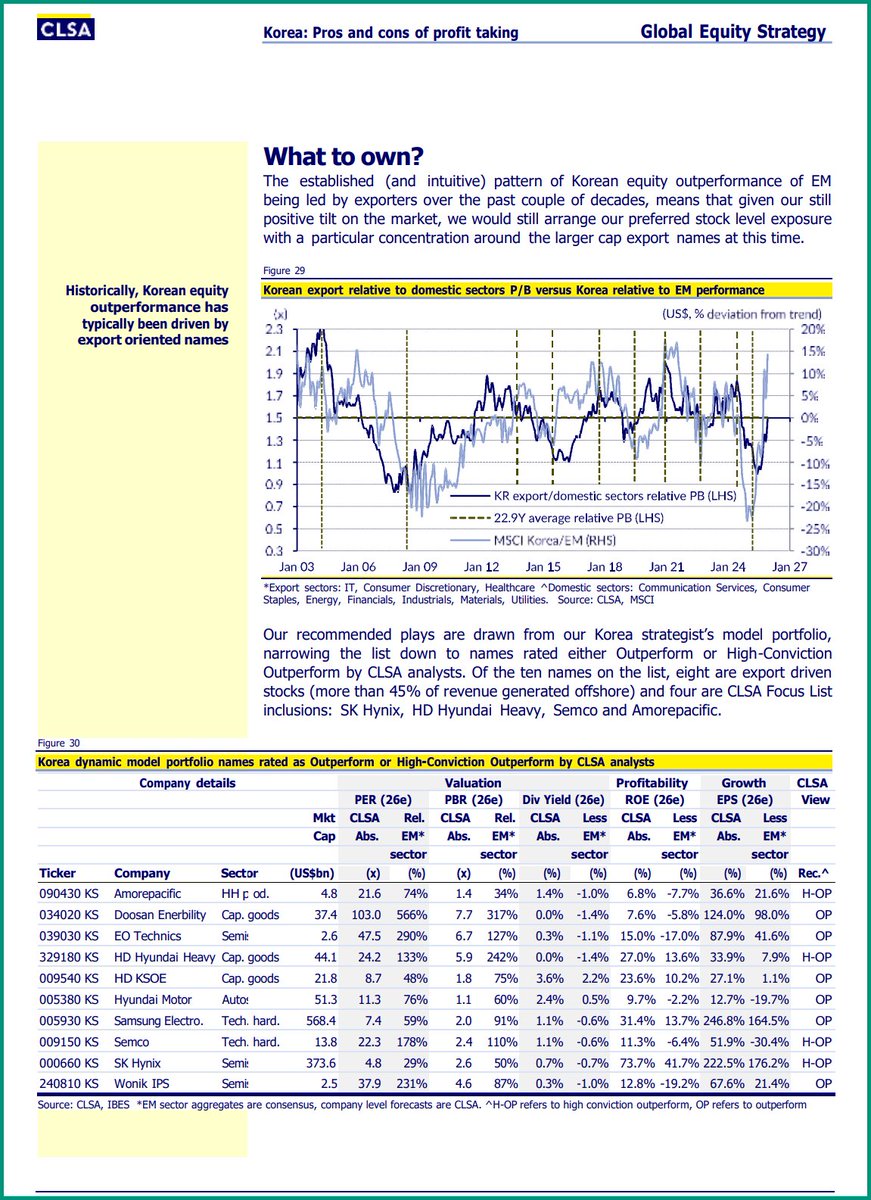
SK Hynix, HD Hyundai Heavy, Semco and Amorepacific are Focus List stocks.
Korea: The pros and cons of profit taking
Following a 160% USD total return for MSCI Korea since January 2025, we outline the reasons to take profits
What to own?
Historically, Korean equity outperformance has typically been driven by export oriented names
HSBC || How does ChatGPT’s ad offering compare with existing channels?
ChatGPT ad MAU potential vs online platform peers ad MAUs (m)
If ChatGPT ads were rolled out globally, it would represent a surface of 10bn min/month vs 60bn for Instagram, we estimate
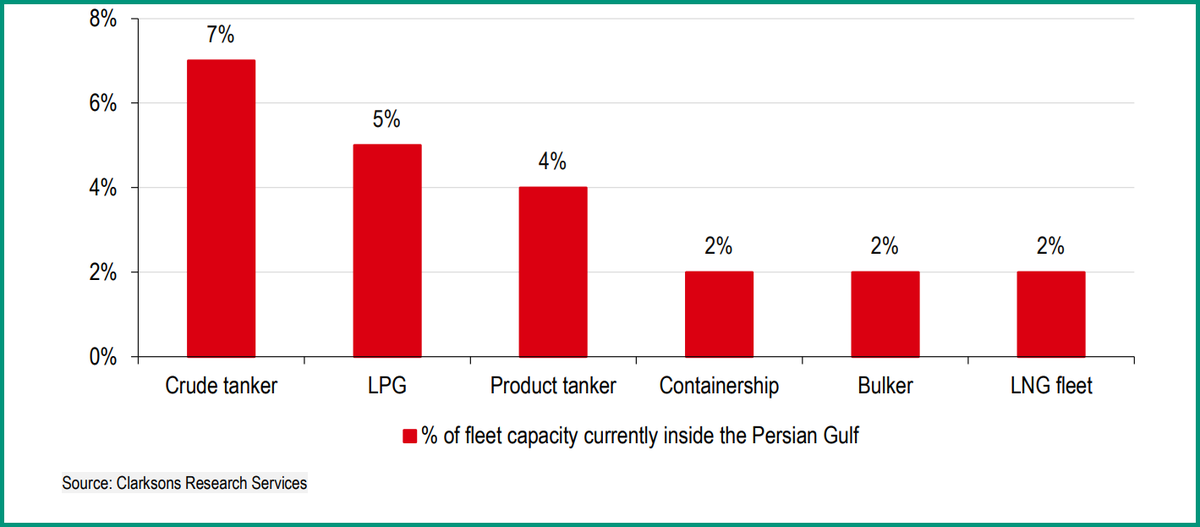
HSBC || Percentage of global seaborne trade flowing via the Strait of Hormuz, by cargo type
Percentage of fleet capacity currently inside the Persian Gulf
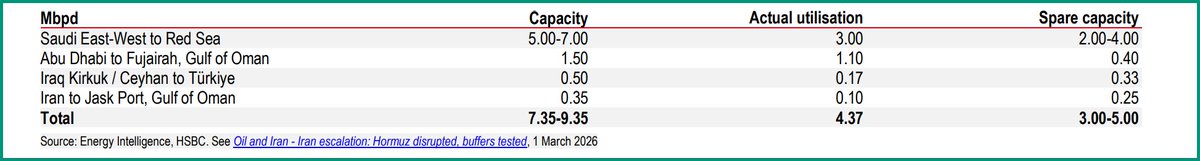
Alternative pipeline routes to the Strait of Hormuz
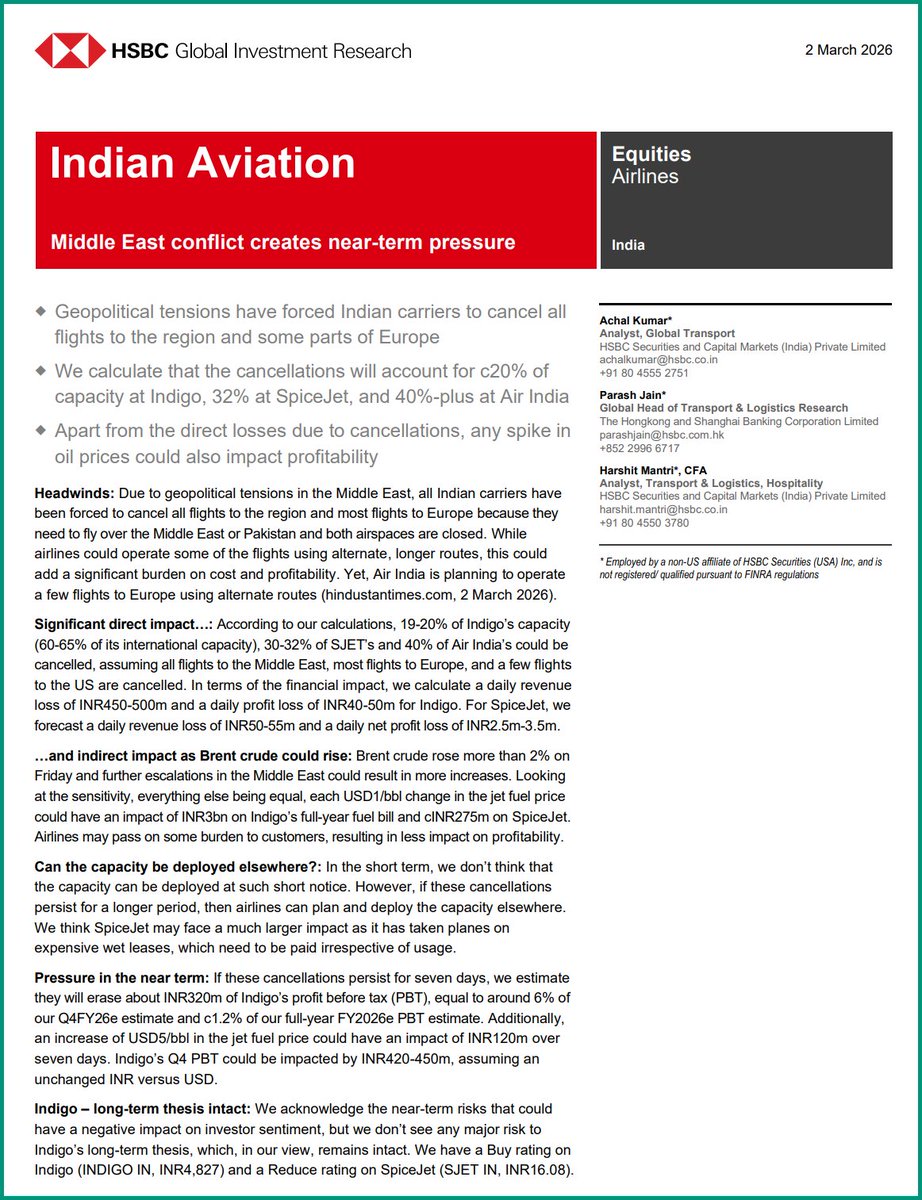
HSBC || Indian Aviation
Middle East conflict creates near-term pressure
◆ Geopolitical tensions have forced Indian carriers to cancel all flights to the region and some parts of Europe
◆ We calculate that the cancellations will account for c20% of capacity at Indigo, 32% at SpiceJet, and 40%-plus at Air India
◆ Apart from the direct losses due to cancellations, any spike in oil prices could also impact profitability
Capacity impact
*Not a HOLI message*
War runs economies. Laziness kills https://t.co/FR4579Q2eU is better to be in motion or war than to remain idle and complacent.
▫️War creates *uncertainty*
▫️Uncertainty creates *panic*
▫️Panic creates *discounts*
▫️*Discounts create opportunities*
This Holi, use the red on the screens as an opportunity to colour your portfolio green over years to come
The disruption in Strait of Hormuz would impact all major Asian oil importers ie. China, South Korea, India and Japan. While China imported more than 4mn barrels per day in 2025, its importing channels are more diversified (only 25% through Strait of Hormuz ) than South Korea and Japan, which have 71% and 61% dependence on Strait of Hormuz.
India is vulnerable with 35% dependence on Strait of Hormuz but also thin reserves