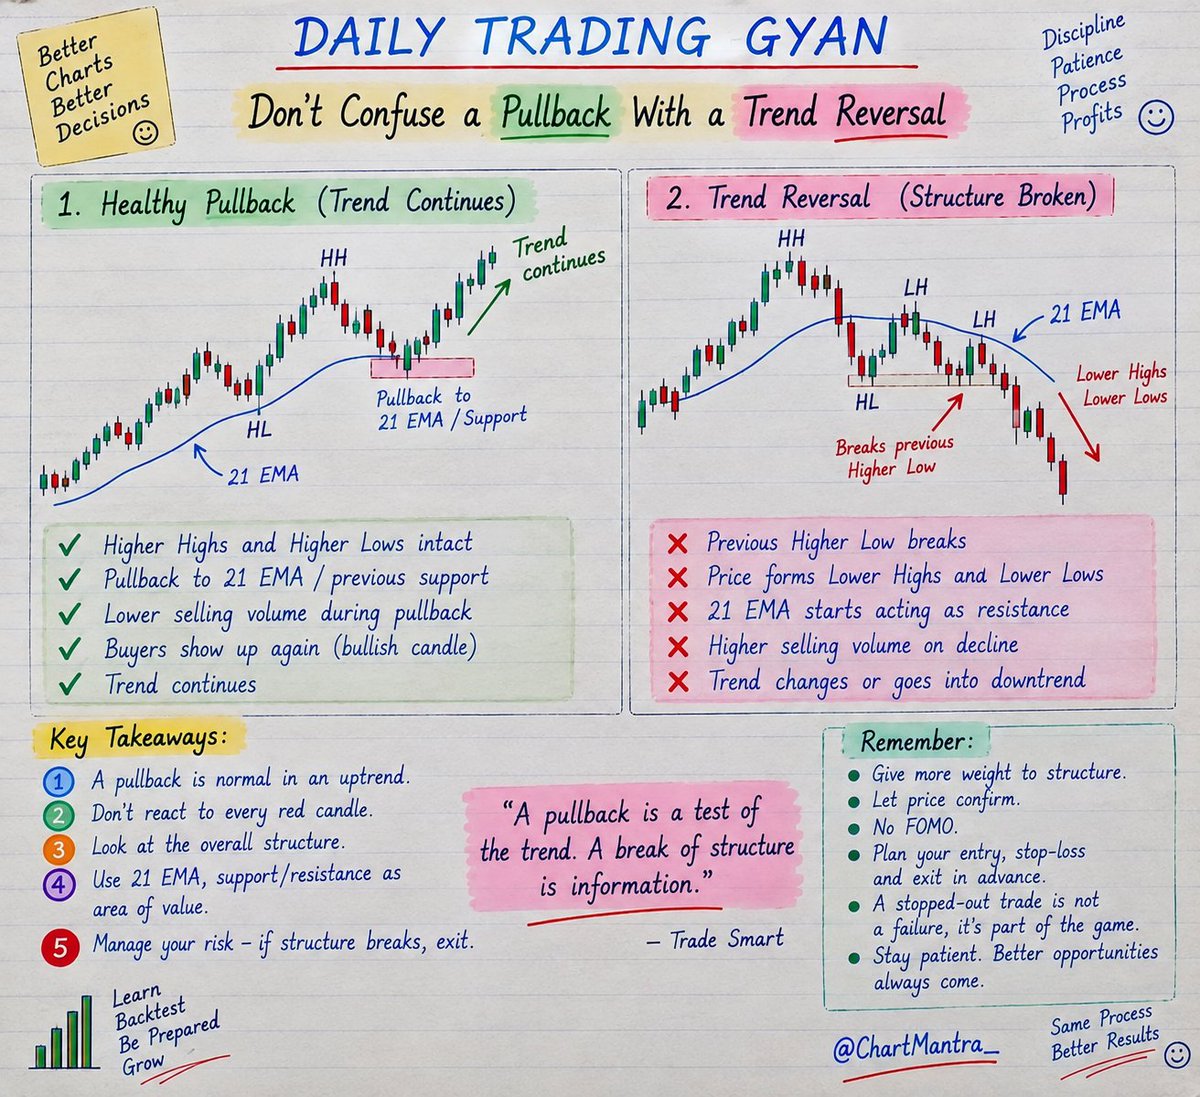
Most traders panic when price pulls back. I watch the structure.
A pullback ≠ a trend reversal.
Healthy trend:
HH → HL → HH → HL
Reversal warning:
HL breaks → LH → LL
Don’t react to every red candle.
Watch the swing structure, 21 EMA, support/resistance, volume & confirmation.
Trade the structure, not the noise.
Follow @ChartMantra_ for practical trading lessons.
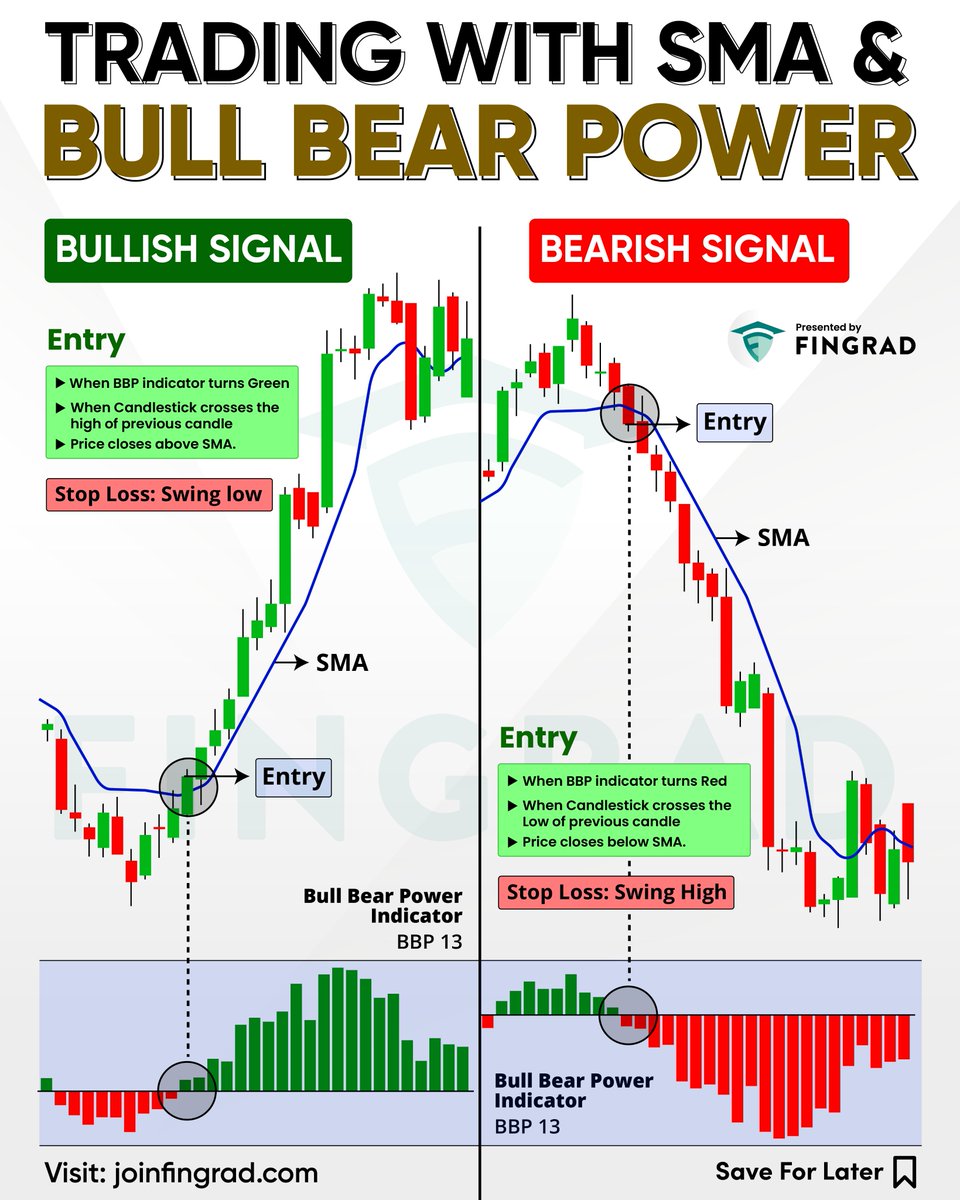
Trading with Bull Bear Power and SMA indicates market momentum and trend direction: bullish when BBP turns positive and price stays above SMA, while bearish when BBP turns negative and price remains below SMA.
Trading with Bollinger Bands Squeeze and Bull Bear Power identifies volatility breakouts and market strength. A squeeze signals potential breakout, while positive Bull Bear Power indicates buying strength and negative readings indicate selling pressure.
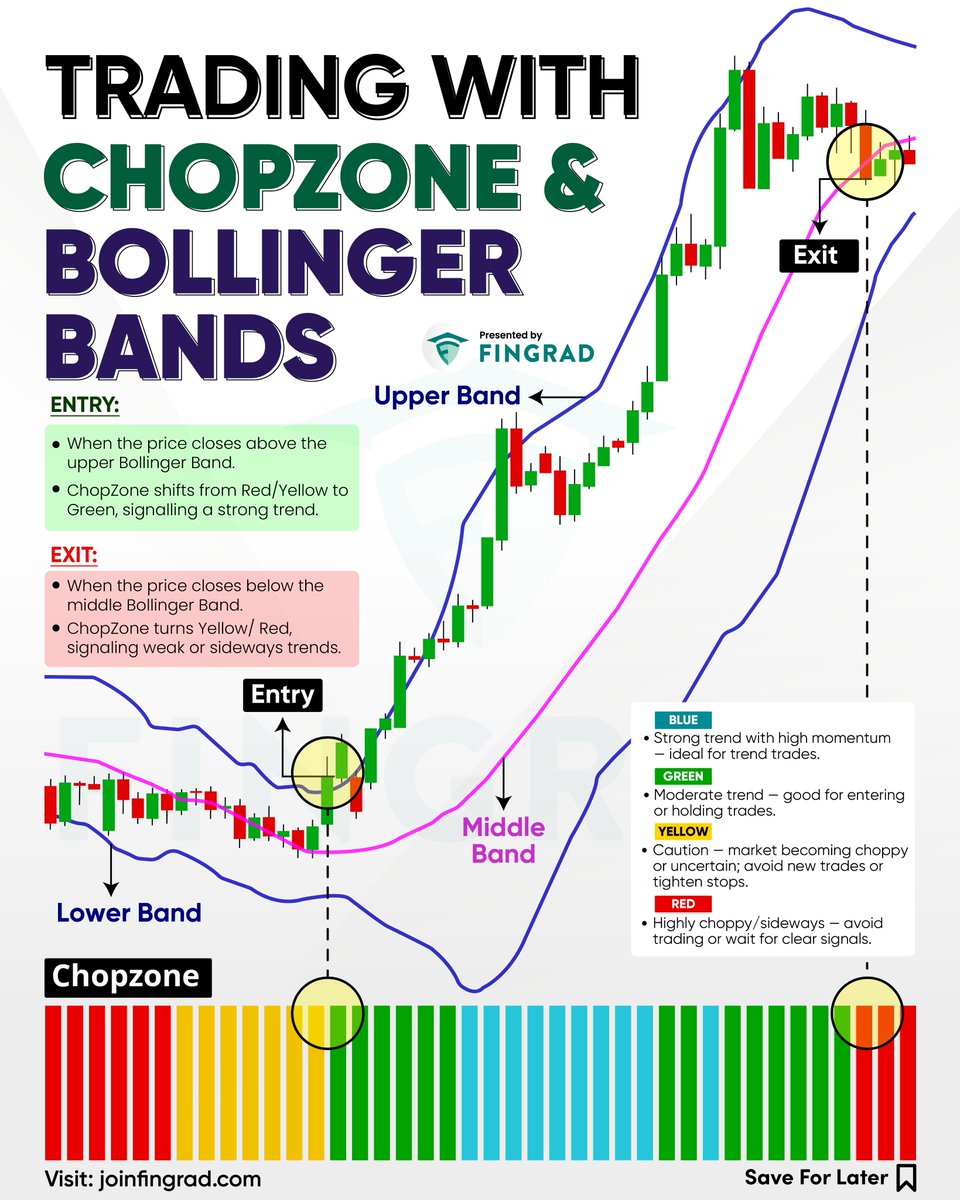
This strategy helps traders identify strong breakouts, confirm trend strength and avoid choppy markets. Combining Bollinger Bands with Chop Zone provides clearer entry and exit signals, supporting disciplined swing trading and reducing weak trade setups.
This guy’s video is LIFE-CHANGING. 🔥
He makes complex concepts incredibly simple and easy to understand.
WATCH IT. WATCH IT. WATCH IT! 👀🔥
You’ll thank me later.
This strategy combines the Supertrend and CMO indicators to identify trend direction and momentum. A long position is considered when Supertrend turns green and CMO crosses above zero, while opposite signals indicate weakening momentum.
The Bullish Harami signals a potential reversal after a downtrend, while a bullish MACD crossover confirms improving momentum, indicating a possible shift from bearish to bullish sentiment and a potential upward move.
This strategy combines Bollinger Bands and MACD to identify potential breakouts and momentum shifts. Price movement beyond key bands, supported by MACD crossovers, helps traders identify entries and exits with greater confirmation.
How I find draw on liquidity in 30 seconds:
Look left on the 1-hour. Find the nearest untouched swing high and swing low.
One of them is the target.
The daily candle tells you which one.
If yesterday's candle closed bullish, the draw is the swing high.
If bearish, the swing low.
That's where price is going.
Enter in the direction of the draw, not against it.
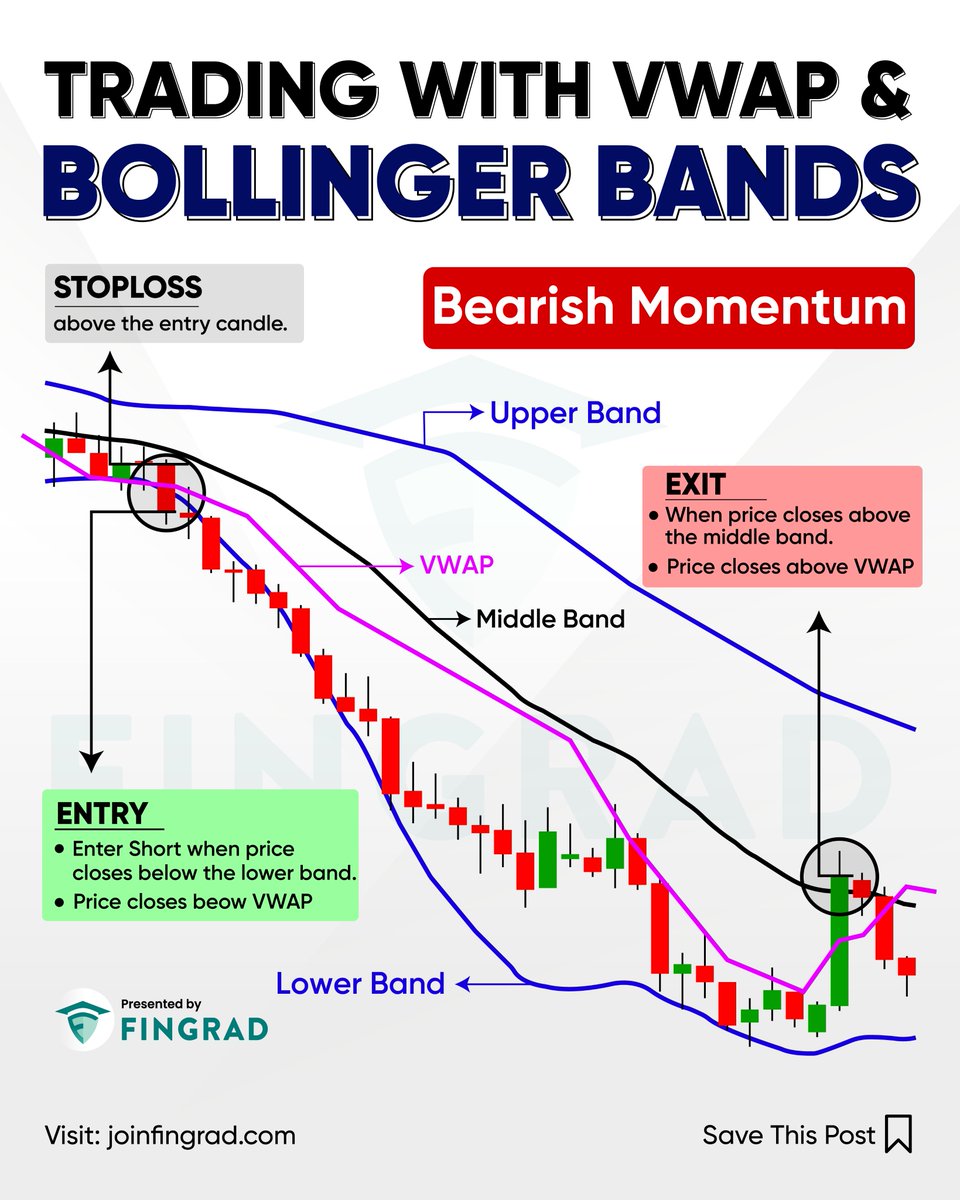
This strategy helps traders identify potential bearish momentum by combining VWAP and Bollinger Bands. It highlights periods of price weakness when the stock trades below key levels, helping traders identify possible short-selling opportunities.