human. life. freedom.
author of power trading with marketprofile & orderflow.
founder, live desk @vtrender.
derivatives market structure, orderflow, and intent.
Cas completed month 2 .
It started in Aug with a strong upward bias
But by the end of Sept , people realised CAS was a clean invitation to buy stock 3% lower than the reference price at 3.15
And the lower liquidity of non rebalance days made that very possible.
The sharp dips we see early in CAS are exactly this
Full report at the link below.
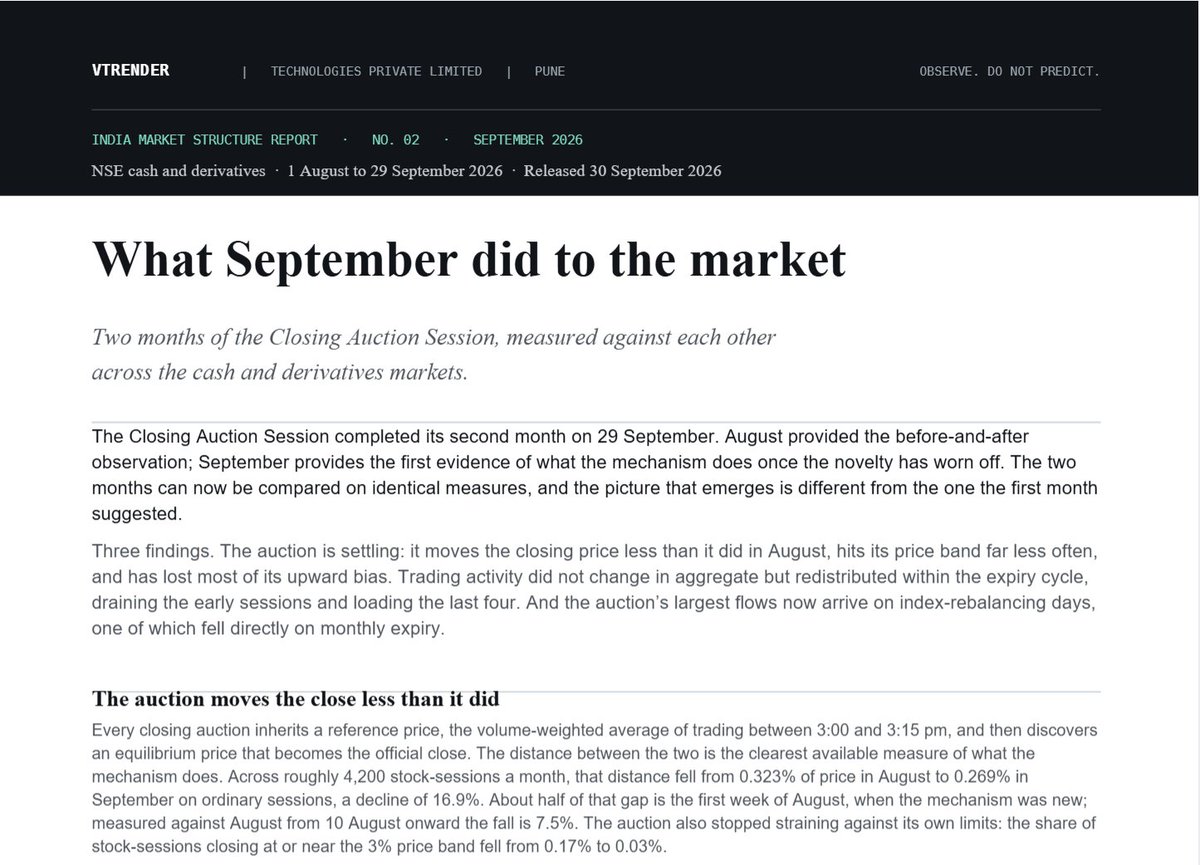
CAS completed Month 2
And sept provides the first evidence of what a mechanism does once the novelty is off
The CAS pic of sept is very different from aug
1) The closing price did less than in Aug
2) Upward bias of Cas is gone
68000 CR in CAS sept against 63630 CR in Aug
3 sessions make 70% of that - all rebalance days
(Money which would have still come anyway)
Net CAS in a month is less than daily cash turnover of the market
Full report on the blog
link in comments
The macros have not changed - all month of Sept and all against India.
The 10 Y US at 5.31, Crude at 102 and USDINR at 96.4 are the positions which have also been undermined internally by a govt with unfriendly market policies.
If you are thinking of buying dips, your position is directly against the worst macro data of the past 20 years.
What happened today had roots in tbe positioning added yesterday as tve new series began
Along with these short call positions , some of which were an extremely high 400% change, there was the IS30 in Nifty futures and all the IB30 in ITM Puts.
Short calls, Short Futes, Long Puts
Triple whammy
cash data is only a part of the equation
The real business is now in Options
All big money- Big funds
Call short build up was 114 to 450% yday
( chart below has details)
Check OF charts always for the IS15 / IS30
This is the movement short term - Not cash market buyng/ selling
If you watch cash only- you are laready misled
Saw a clip of commentators walking through the last two years — Iran, currency swings, tariffs, Trump — making the point that despite all of those negatives, Nifty is still near 23,140.
Some bull. Blind one also!
Nifty 50: ~26,175 (Sept 2024) → ~23,140 (Sept 2026).
Change: -11.6%.~ That's Minus 11.6%
Same two years, other markets:
United States (S&P 500): +35.0%
South Korea (KOSPI): +166.4%
Japan (Nikkei 225): +66.9%
Germany (DAX): +30.5%
India (Nifty 50): -11.6%
India is the only red number on that list.
Across the traders I speak with — retail to HNI — sentiment is very flat to negative on the way our markets are being conducted.
Two things come up most: the tax structure, and the derivatives regulation change. The market wasn't in a bubble when that hit. It broke the bull run.
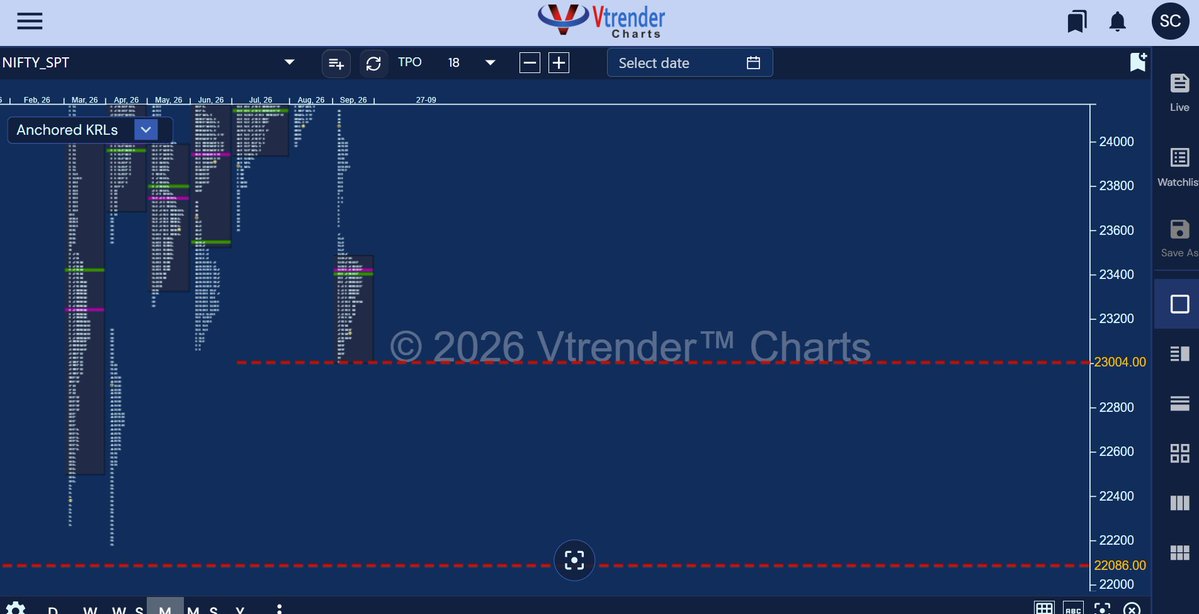
At 23,000, we're at an edge again. My friends say in Hindi agey Kagaar hain.
From where we are 22,200–22,100 gets tested once more.
Uske neeche, gehri khaai.
Sept 27- a tale of a kagaar and a Khaai
"At 23,000, we're at an edge again.
My friends say in Hindi agey Kagaar hain.
From where we are 22,200–22,100 gets tested once more.
Uske neeche, gehri khaai."
Saw a clip of commentators walking through the last two years — Iran, currency swings, tariffs, Trump — making the point that despite all of those negatives, Nifty is still near 23,140.
Some bull. Blind one also!
Nifty 50: ~26,175 (Sept 2024) → ~23,140 (Sept 2026).
Change: -11.6%.~ That's Minus 11.6%
Same two years, other markets:
United States (S&P 500): +35.0%
South Korea (KOSPI): +166.4%
Japan (Nikkei 225): +66.9%
Germany (DAX): +30.5%
India (Nifty 50): -11.6%
India is the only red number on that list.
Across the traders I speak with — retail to HNI — sentiment is very flat to negative on the way our markets are being conducted.
Two things come up most: the tax structure, and the derivatives regulation change. The market wasn't in a bubble when that hit. It broke the bull run.
At 23,000, we're at an edge again. My friends say in Hindi agey Kagaar hain.
From where we are 22,200–22,100 gets tested once more.
Uske neeche, gehri khaai.
cash data is only a part of the equation
The real business is now in Options
All big money- Big funds
Call short build up was 114 to 450% yday
( chart below has details)
Check OF charts always for the IS15 / IS30
This is the movement short term - Not cash market buyng/ selling
If you watch cash only- you are laready misled
Strike Call OI OI change Call premium move Interpretation 22,700 CE 87.3L +143.3% −₹100.95 Call short build-up 22,750 CE 39.8L +425.2% −₹91.50 Call short build-up 22,800 CE 82.3L +113.7% −₹81.55 Call short build-up 22,850 CE 34.6L +224.8% −₹72.15 Call short build-up 22,900 CE 87.6L +239.7% −₹60.50 Call short build-up 23,000 CE 1.17cr +75.0% −₹41.35 Call short build-up
The last few weeks have been quiet, but below the surface there is enough to suggest things could change very quickly.
Derivatives traders should be alert to big driving possibilities as we move into Oct
Things are about to change
Start the Vtrender eCourse here:
https://t.co/S3p7mg6eWw
Your enrolment includes 15 days of Vtrender Charts Elite access to study the course alongside the live charts.
https://t.co/S3p7mg6eWw
"Markets don't move because people buy. Markets move because people are trapped and need to exit." Chapter 4, From price to wisdom.
“this is a business of probability, not certainty.”
value area, poc and excess show where trade was accepted and where it was rejected. the structure informs the decision; it does not promise the outcome.
the sept Market structure report is alos on blog with link to downlaod the pdf
https://t.co/Yub6zAAPgs
This is the top 100 most traded contracts of Sept
HDFC bank was the biggest
we track number of contracts traded
CAS completed Month 2
And sept provides the first evidence of what a mechanism does once the novelty is off
The CAS pic of sept is very different from aug
1) The closing price did less than in Aug
2) Upward bias of Cas is gone
68000 CR in CAS sept against 63630 CR in Aug
3 sessions make 70% of that - all rebalance days
(Money which would have still come anyway)
Net CAS in a month is less than daily cash turnover of the market
Full report on the blog
link in comments
CAS report - https://t.co/qO1RDTwlfF
What two months cannot tell us: whether this continues, whether the remaining gap to July is permanent, or whether anything here is caused by the auction rather than merely coincident with it. We measure it again next month.
It's not just only DII and FII. That' s cash market, only 50 % of the picture.
The real market is cash + futures + options.
See demand and supply in all 3, not just 1.
Today 23800 Put was short into the Open.
From a price of 40 -65
Open came abv 83.
They unwound 10 L contracts in first 30 mins as gamma exploded against that positioning.
Price moved from 83 to 231
30 mins
10 L contracts unwound
When unwinding was finished, the market stopped going lower.
Demand and supply of the market as a whole is the way.
Not 1 part of it.
People are talking about an India US Trade deal pre Diwali
Worst timing ever. And will be bad for markets.
I'll tell you why
Nov 3. US mid term elections.
Trump should lose badly and I think is a lameduck for the rest of his term.
He will be inconsequential especially with tariffs.
Modi 3.0 has messed everything from Op Sindoor in May last year to taxes in markets to pushing instis out to treating traders as second class citizens.
I hope they don't do this trade deal. It will be bad for markets. You saw how the market reacted post that big gap up last time.