Pra frança se equiparar ao Brasil, vocês teriam que ganhar no mínimo mais três copas do mundo. Já pro Brasil se equiparar a frança, a gente teria que invadir e massacrar no mínimo 20 países do continente africano
realmente, não somos iguais
(...) chosen at random for the rest. Once all regions are filled, hide the basemap and display the result on the map. Include a button to export the offscreen canvas as a PNG.
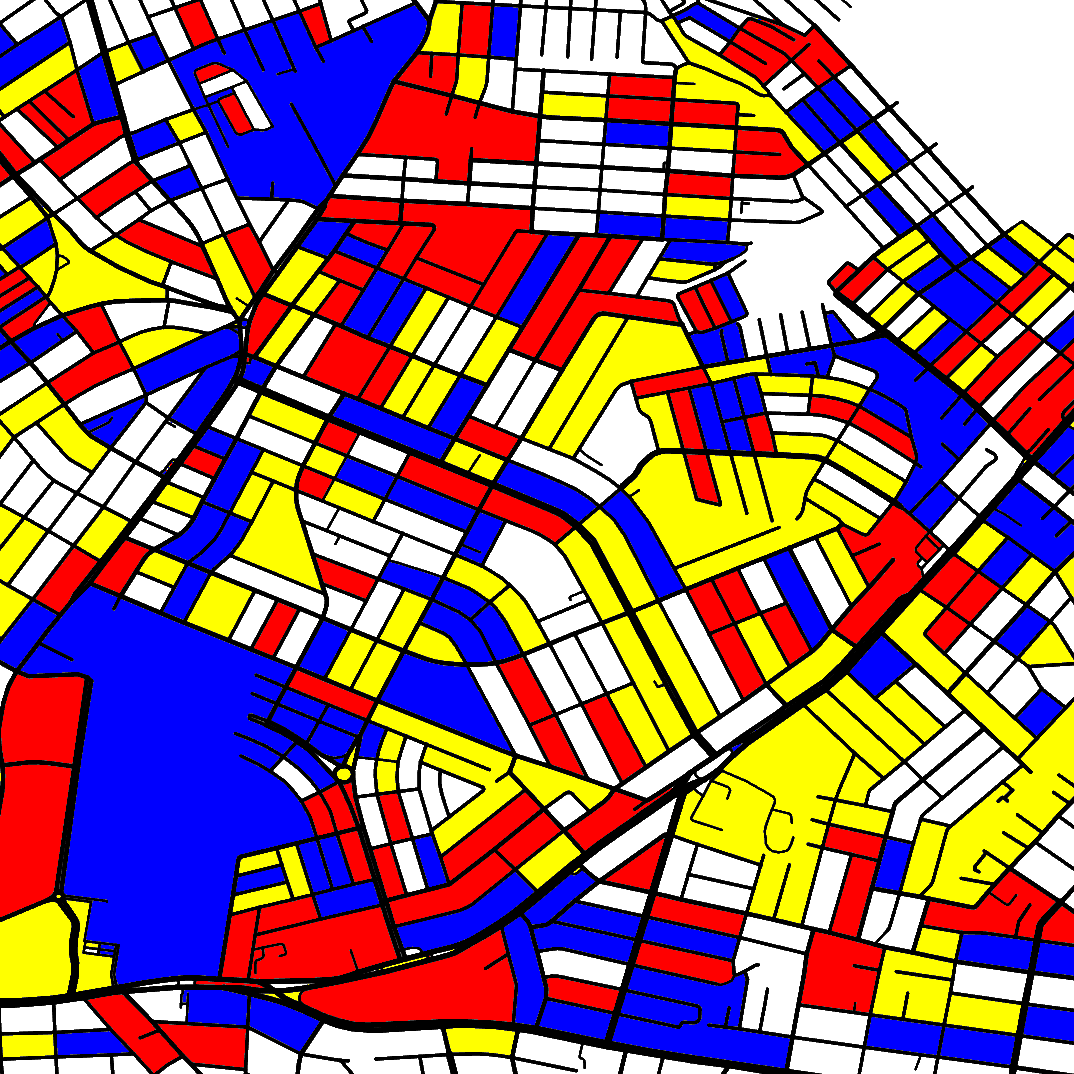
Create a web app using MapLibre GL JS and Vite. The user draws a bounding box on the map, then the app fetches only street geometry for that area from the Overpass API. Draw all street segments as black lines onto a transparent offscreen canvas sized to the bounding box.
Scan that canvas and each time an unvisited transparent pixel is found, apply a paint-bucket flood fill assigning one color to the entire connected region: white (#ffffff) in roughly one third of regions, and red (#ff0000), yellow (#ffff00), or blue (#0000ff) (...)
One third of them should be white, the remaining elements should be drawn in one of the other three colors, randomly. Once the streets and the other elements are rendered, the basemap is hidden. Include a button to export the bounding box area as a cropped PNG.
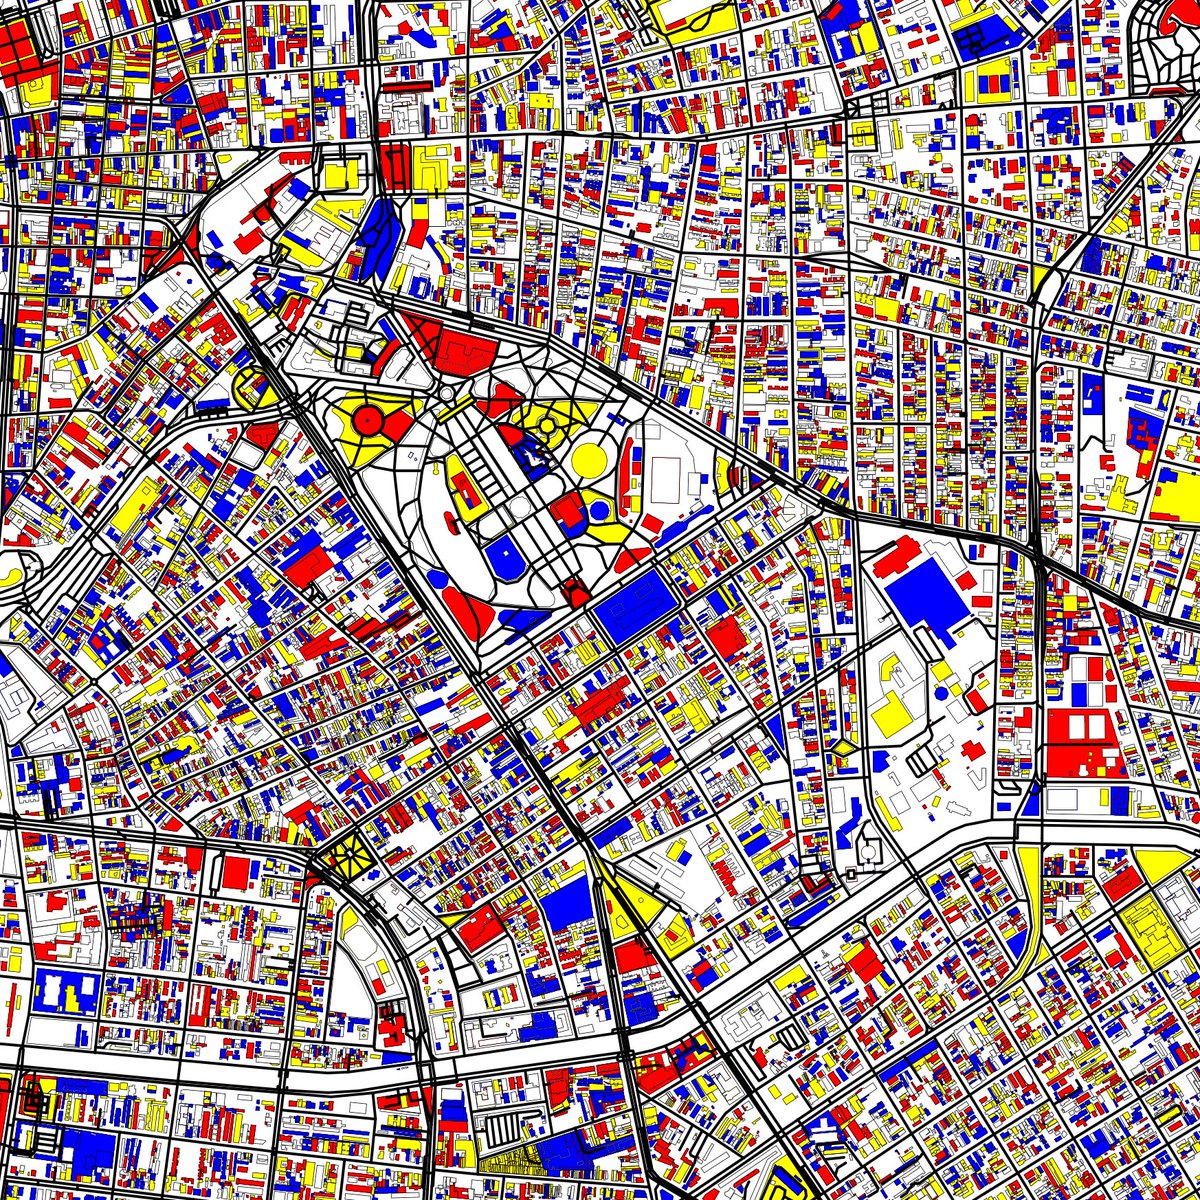
Create a web app using MapLibre GL JS and Vite. The user draws a bounding box on the map, then the app fetches street geometry for that area from the Overpass API as GeoJSON and renders it as a new layer.
Each street segment should be drawn in black, and all blocks, parks, squares and other elements represented by polygons in the maps should be drawn in red (#ff0000), yellow (#ffff00), blue (#0000ff) or white (#ffffff).
Once the streets are rendered, the basemap is hidden and replaced with a plain white background, leaving only the colored segments visible. Include a button to export the bounding box area as a cropped PNG.
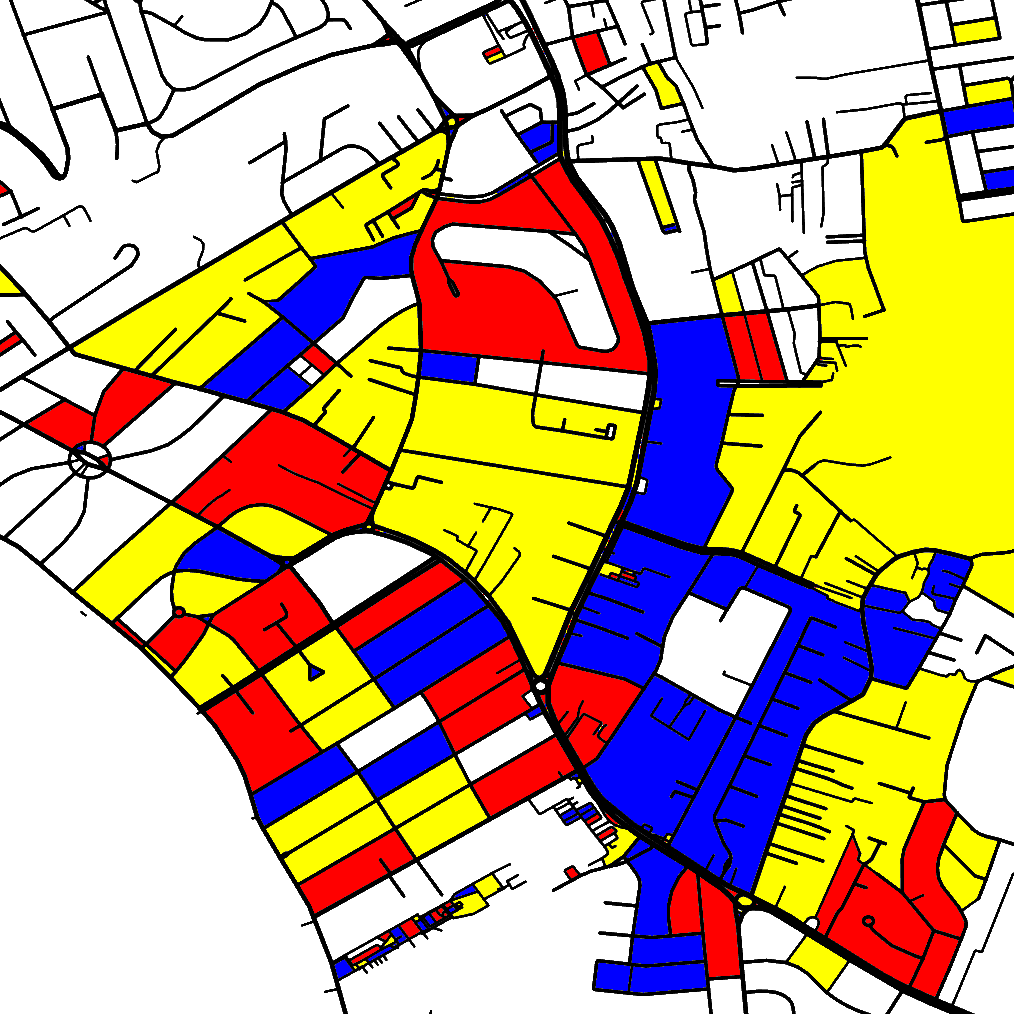
Create a web app using MapLibre GL JS and Vite. The user draws a bounding box on the map, then the app fetches street geometry for that area from the Overpass API as GeoJSON and renders it as a new layer.
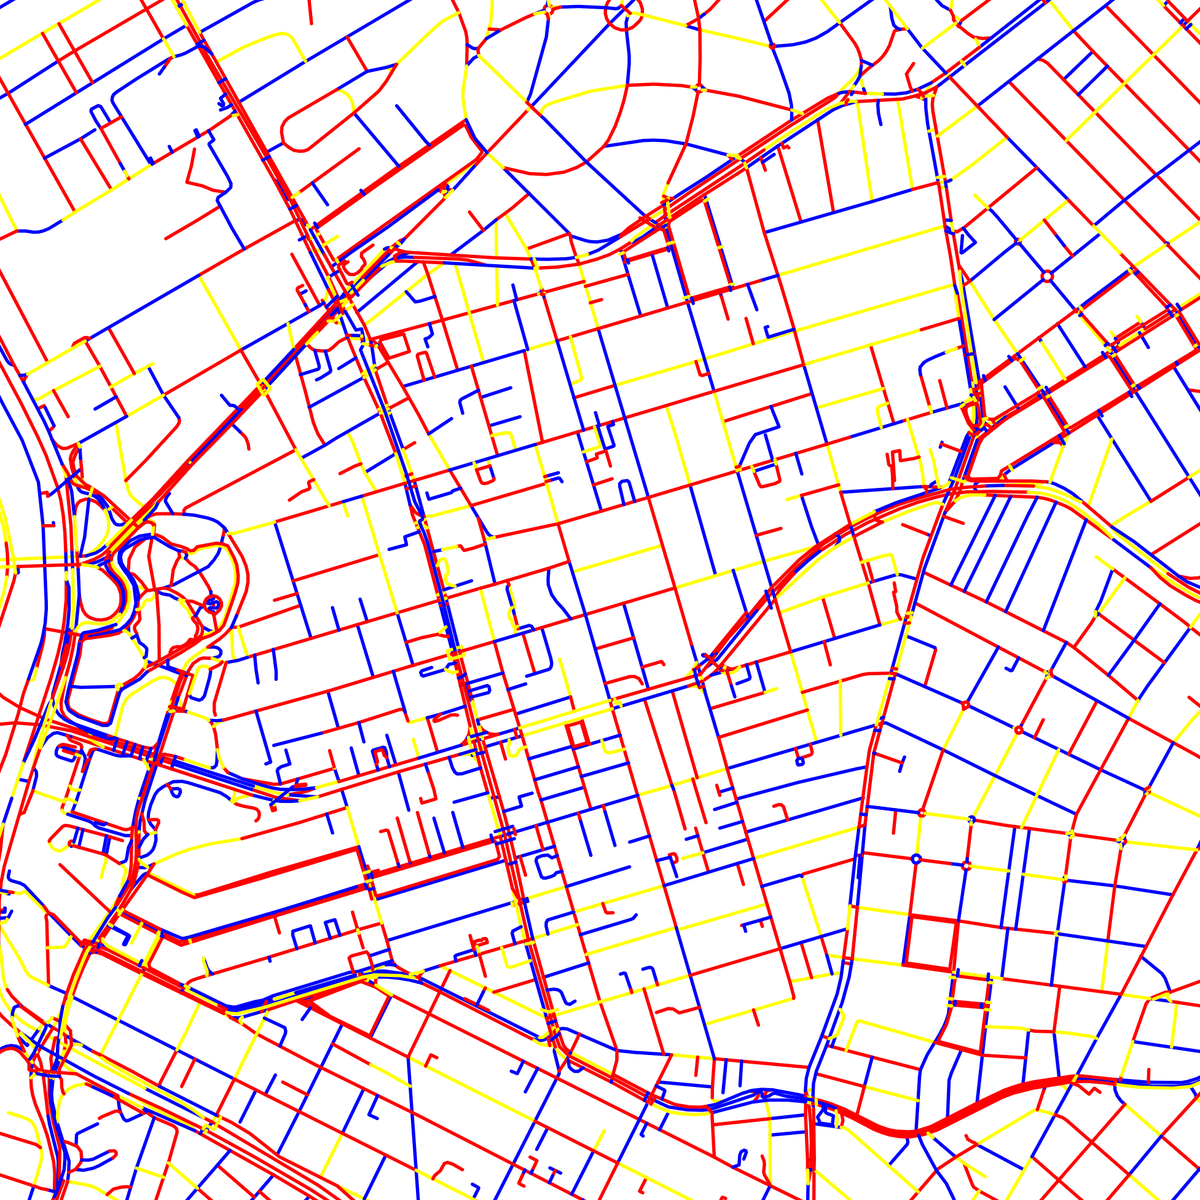
Each street segment is automatically assigned a color — red (#ff0000), yellow (#ffff00), or blue (#0000ff) — so that no two adjacent segments share the same color if possible.
The number of interpolation lines should be a random number between 2 and 100.
Save a text file containing the colors of all points used and their average color.
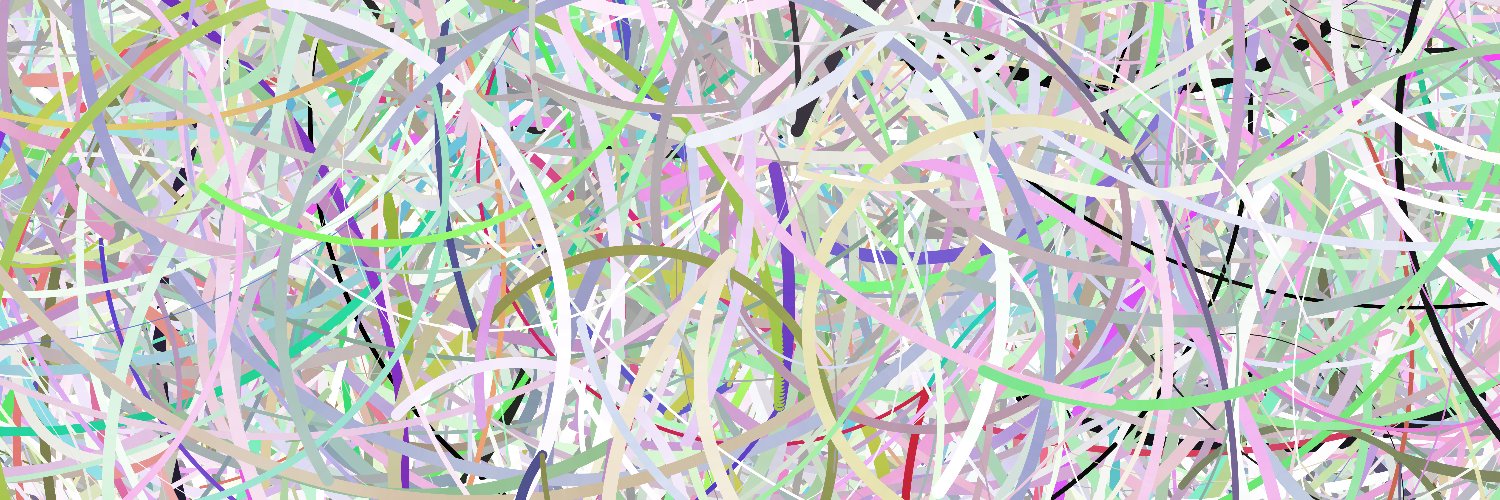
Load all points from the CSV. Randomly select between 6 and 9 sets, each containing 2 points. For each set, draw a line connecting the points. Fill each line with a gradient by interpolating the colors of the start and end points of each line segment.
Calculate all the combinations of two sets. For each combination, draw interpolated lines between the two lines, interpolating the positions of their respective start and end points, and the colors and the width as well.
The number of interpolation lines should be a random number between 2 and 100.
Save a text file containing the colors of all points used and their average color.
Load all points from the CSV. Randomly select between 6 and 9 sets, each containing 2 points. For each set, draw a line connecting the points. Fill each line with a gradient by interpolating the colors of the start and end points of each line segment.
Calculate all the combinations of two sets. For each combination, draw interpolated lines between the two lines, interpolating the positions of their respective start and end points, and the colors and the width as well.
The spacing between adjacent parallel lines should be a random value between 3 and 6 times the line width.
Save a text file containing the colors of all points used and their average color.
Load all points from the CSV. Randomly select between 3 and 6 sets, each containing 2 to 5 points. For each set, draw a line connecting the points, ensuring that the line does not intersect itself. (...)