$BTC has now fallen back into the $60,000 range.Broader macroeconomic pressures suggest there could still be further downside ahead.While short-term rebounds may occur, they are likely to be weaker than the relief rally seen earlier this year.
$BTC appears to be approaching a major breakout.
A symmetrical triangle has formed, with key resistance around $63,000 and support near $61,000. The next significant move will likely be determined by which level gives way first.
$BTC
Today's daily candle is showing little to no lower wick, which isn't typically the strongest signal.
Price has trended upward throughout the day without revisiting the daily open, indicating a one sided move.
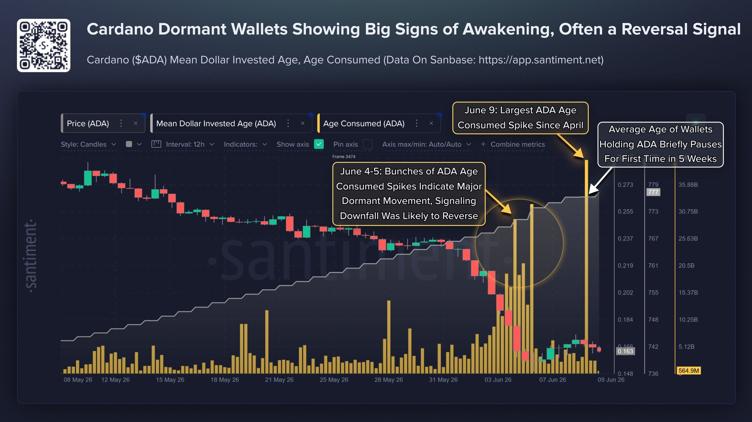
$ADA wallets are stirring.
According to Santiment, Cardano just recorded its largest spike in "Age Consumed" since April , a sign that long-inactive supply is finally starting to move.
#BTC
$CKB-USD ⛓️ Respecting trend support with higher lows forming. Clearing resistance may open the path toward stronger upside targets. Momentum remains constructive 🔥📊
$JASMY-USD 💾 Holding key support while consolidating beneath resistance. A breakout above the current range could trigger another data-sector momentum wave. Watch volume and daily closes for confirmation 📈🚀
$WFI is building the infrastructure layer for the future of onchain finance, connecting users worldwide through a seamless and interoperable ecosystem.
$MANA-USD 🌆 Respecting trend support with higher lows forming. Clearing resistance may open the door toward stronger upside targets. Momentum remains constructive 🔥📊
$BTC
Today's daily candle is showing little to no lower wick, which isn't typically the strongest signal.
Price has trended upward throughout the day without revisiting the daily open, indicating a one sided move.
$SAND-USD 🏖️ Holding key support while consolidating beneath resistance. A breakout above the current range could fuel another metaverse-driven rally. Watch volume and daily closes for confirmation 📈🚀
$XRP is eyeing a breakout into price discovery territory, something we haven’t seen since 2017.
If it clears the all-time high, things could get very interesting.
#WLFI#Phantom
$BTC Market Read
BTC finally caught a reaction from the 59,130 zone after a heavy daily selloff. The bounce is decent, but the price is still below the broken structure, so bulls need to prove strength above 64,500 to 65,000 before calling this a proper reversal.
$INJ Setup
INJ is one of the cleaner charts here. After topping near 7.34, price cooled down into the 4.80 demand zone and now buyers are stepping back in with strength. The current move around 5.76 shows a solid recovery, but the next real test is the 6.00 to 6.15 area.
$MET Chart View
MET is still in a clear downtrend, but the reaction from 0.0943 shows buyers are finally defending the lower zone. The price is now around 0.104, trying to build a small base after a heavy drop from 0.190.