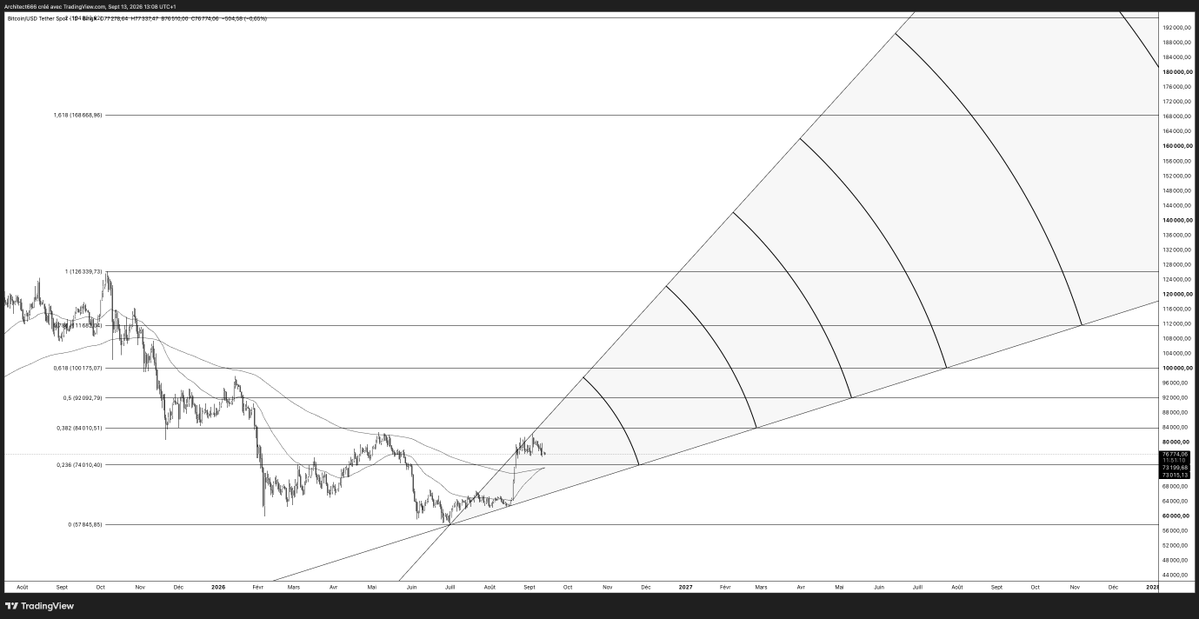
$BTC — Who could have predicted. 🤷🏻♂️
“Don’t forget what the boss is capable of.”
Since then:
~$76K → $86K+
And we’ve already started working through the next levels on the roadmap.
Still a long way to $100K+.
But this is exactly what I meant:
BTC can change speed very, very quickly.
Don’t let months of chop make you forget what this asset is capable of.
bitcoin:native — Don’t forget what the boss is capable of.
For months now, we’ve been getting used to slow and frustrating price movements. Narrow trading ranges, unsuccessful breakout attempts, endless ranges.
All of this can make you forget one thing:
BTC can experience sharp price fluctuations.
We’ve seen this happen before:
• 2016 → 2017: from about $300–$400 to about $19,600
• March 2020 → April 2021: from about $3,900 to about $65,000
• January → March 2024: from about $38,000 to about $73,000
• October → December 2024: from about $59,000 to about $108,000
• 2025: from $76,000 to over $120,000 in a few months
Bitcoin doesn���t always follow a steady trend.
Sometimes it stagnates, frustrating everyone, getting the market used to slow price movements… and then completely changes speed.
That’s why I wouldn’t be surprised to see a much more dynamic phase in the coming weeks and months.
Over $100,000 by the end of 2026 or the first quarter of 2027? Possible.
A return to the ATH during this period wouldn’t surprise me either if the momentum really picks up and we enter a fomo / euphoria phase.
When BTC decides to make a move, months of anticipation can materialise in a matter of weeks.
@AskCryptoWealth@AskCryptoWealth Do you still believe in SEI? You've recommended it several times, and it has since dropped by 80–90% and seems to be struggling to regain momentum. What do you think about it?
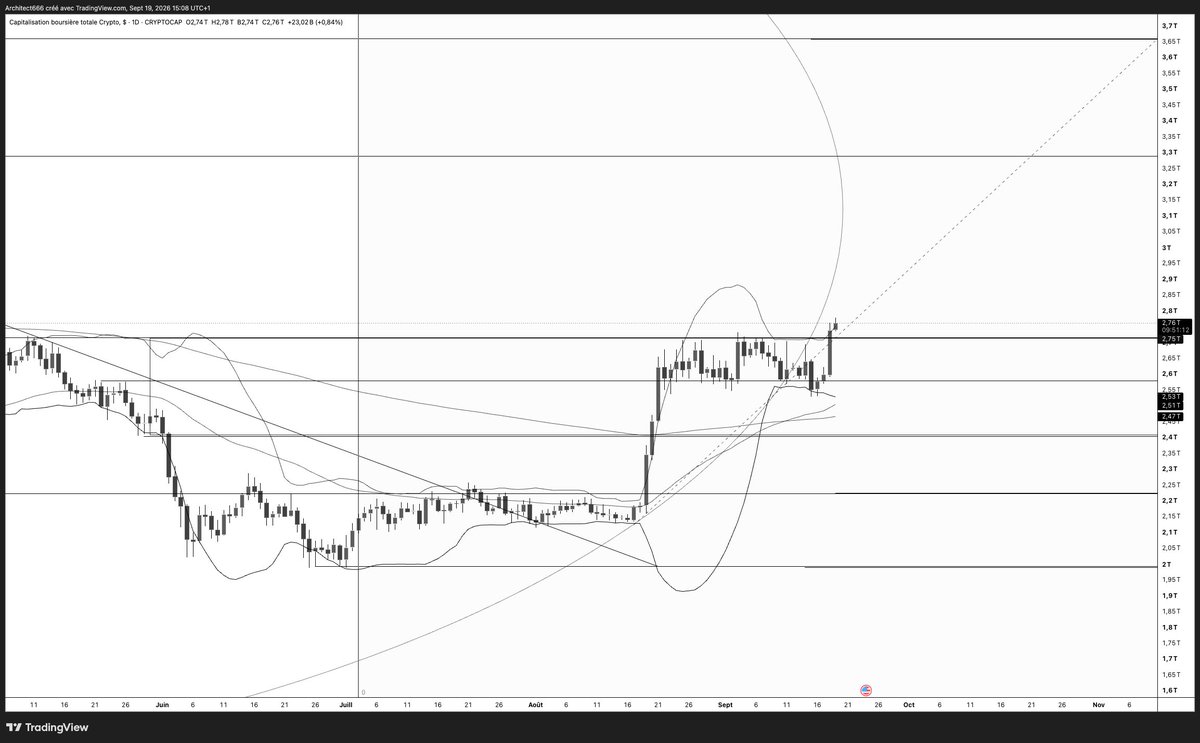
$TOTAL — Bollinger squeeze resolved to the upside. 🚀Earlier this week, the Bollinger Bands were extremely compressed — telling us that a volatility expansion was getting close, but not giving us the direction.We got the first move lower after the Senate failed to advance the CLARITY Act and the Fed raised rates by 25 bps.But that breakdown failed.Price tested the lower side, sellers couldn’t generate sustained follow-through, the market reclaimed the range — and now TOTAL has broken through the upper Bollinger Band around $2.71T, trading near $2.76T on my chart.That’s exactly the kind of failed breakdown → opposite-side expansion I was watching for.Alts have reacted strongly as well, with several already reclaiming the losses from the initial selloff and pushing into new local highs.For now, this is a very constructive setup.Compression → fake breakdown → upside https://t.co/huI9jPUDb0 bias remains bullish, but now the important part is follow-through and acceptance above the breakout rather than just a wick.The market is waking up.I’ll keep monitoring the structure and update as it develops. 🎯
$TOTAL — Bollinger squeeze resolved to the upside. 🚀
Earlier this week, the Bollinger Bands were extremely compressed — telling us that a volatility expansion was getting close, but not giving us the direction.
We got the first move lower after the Senate failed to advance the CLARITY Act and the Fed raised rates by 25 bps.
But that breakdown failed.
Price tested the lower side, sellers couldn’t generate sustained follow-through, the market reclaimed the range — and now TOTAL has broken through the upper Bollinger Band around $2.71T, trading near $2.76T on my chart.
That’s exactly the kind of failed breakdown → opposite-side expansion I was watching for.
Alts have reacted strongly as well, with several already reclaiming the losses from the initial selloff and pushing into new local highs.
For now, this is a very constructive setup.
Compression → fake breakdown → upside expansion.
My bias remains bullish, but now the important part is follow-through and acceptance above the breakout rather than just a wick.
The market is waking up.
I’ll keep monitoring the structure and update as it develops. 🎯
$TOTAL — Something is loading.
Daily Bollinger Bands are tightening fast.
A Bollinger squeeze doesn’t predict direction — it tells us that volatility is compressing and a larger move is likely approaching.
For now, structure gives me a slight bullish bias.
TOTAL is still defending the ~$2.56T local support while compressing directly beneath the ~$2.71T expansion level.
Hold here → pressure keeps building for a move north.
Break ~$2.71T → the path toward $3.3T starts opening again.
Lose the current structure → my ~$2.42T correction zone remains very much alive.
BTC is telling a similar story: liquidity remains on both sides, with shorts above and longs below waiting to be cleaned.
My current scenario?
A squeeze north first wouldn’t surprise me at all.
Take the liquidity above, convince everyone the breakout has started… then potentially come back later for the deeper $70–74K BTC reset everyone was waiting for in the first place.
This week has real catalysts too: FOMC on Wednesday, while the CLARITY Act begins its next Senate procedural step on Tuesday.
Compression is here.
Now we wait for expansion.
bitcoin:native — The breakout window delivered. 🎯
Earlier this week, I flagged Thursday/Friday as a potential timing window for expansion.
BTC was trading around $76K.
We then got the move:
$76K → $80K+
Almost exactly into the window we were watching.
And the move didn’t happen in isolation — the broader alt market responded immediately, with several names printing very strong follow-through.
That’s why I keep paying attention to confluence rather than one single indicator:
price structure, Fibonacci timing, liquidity, momentum.
None of them guarantees the move.
But when several of them point to the same area and the same window, it deserves attention.
Hopefully some of you caught the trade.
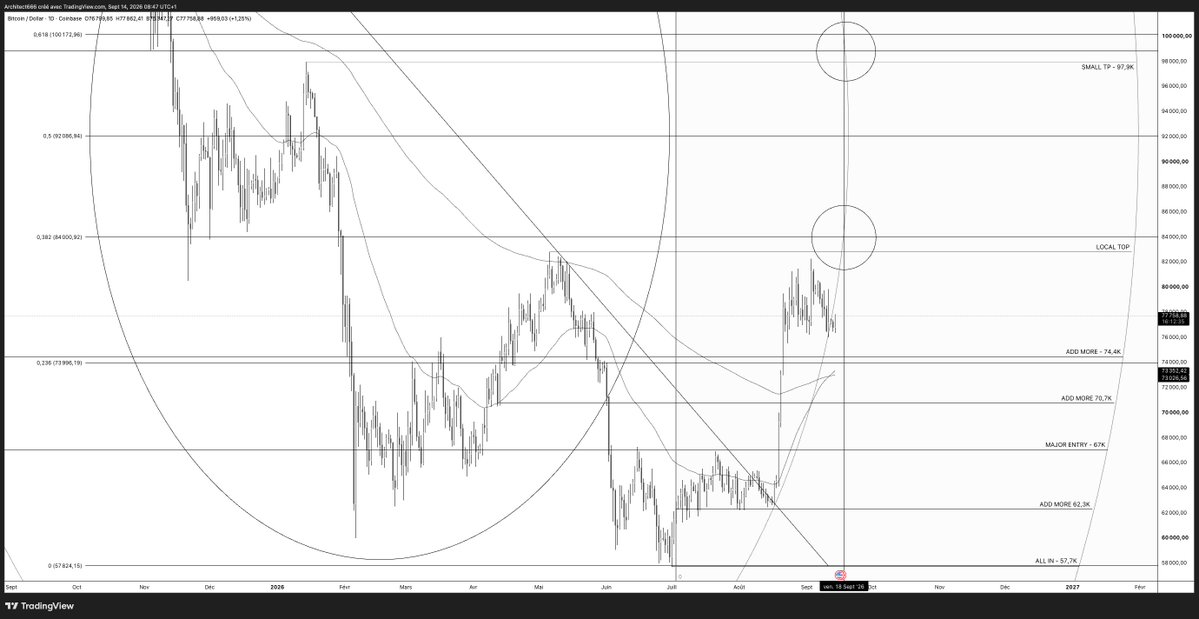
Now BTC is approaching the next zone we’ve been tracking around $83–85K.
The breakout happened.
Now we see how far it wants to run. 👀
bitcoin:native — Interesting Fibonacci confluence into the end of the week 👀
I’ve been tracking these Fib circles from the ~$126K top down to the 2026 lows (57,7K), and something interesting is lining up around Thursday/Friday.
The next geometric intersection lands almost exactly in the $83–84K area:
• Fib retracement 0.382 → ~$84.0K
• Previous local high → ~$82.8K
• Short liquidity we identified → ~$85K
That’s a pretty dense cluster.
Does a Fibonacci circle mean BTC has to be there this week? Absolutely not.
But combined with the liquidation map, current compression and the structure we’ve been following, it reinforces my preferred scenario:
Hunt liquidity north first → then potentially retrace deeper later.
This week also brings real headline risk: the FOMC meets Sept. 15–16, with the rate decision Wednesday, while the Senate’s next procedural step on the CLARITY Act is scheduled for Tuesday.
But I’m careful about building trades around headlines alone.
Markets front-run events.
Bullish news can sell off.
Bad news can get absorbed.
Sometimes the move was already priced before the headline even arrived.
So I’m watching price first.
$83–85K remains the northern magnet on my board.
My bias: north first, south later.
Let’s see if Fibonacci wants to show off again.
$UNI — Another setup starting to deliver. 🎯
We mapped an entry zone around $5.8–6.0.
UNI is now trading around $8.6, roughly +43–49% above that area.
Clean setup, clean execution.
What I like most is that this move is happening while the broader alt market is starting to wake up, which gives the breakout more context than an isolated pump.
Still early in the roadmap, but so far the structure is doing exactly what we wanted to see.
Hopefully some of you caught the move.
Now the job is simple: manage the winner, don’t chase it.
ethereum:0x1f9840a85d5af5bf1d1762f925bdaddc4201f984 — One of the cleaner reversals on the board. 👀
After spending most of 2026 building a base, Uniswap has finally broken out of compression and pushed back above its key moving averages.
What interests me here isn’t just the size of the move — it’s the change in structure.
Higher low. Expansion. Momentum returning.
The macro chart is still heavily damaged, so I’m not treating this as a confirmed full-cycle reversal yet.
But compared with many legacy alts, UNI is starting to look alive again.
Now the question is simple: can buyers defend the breakout and turn this first impulse into a real trend?
No chasing. Let the structure prove itself.
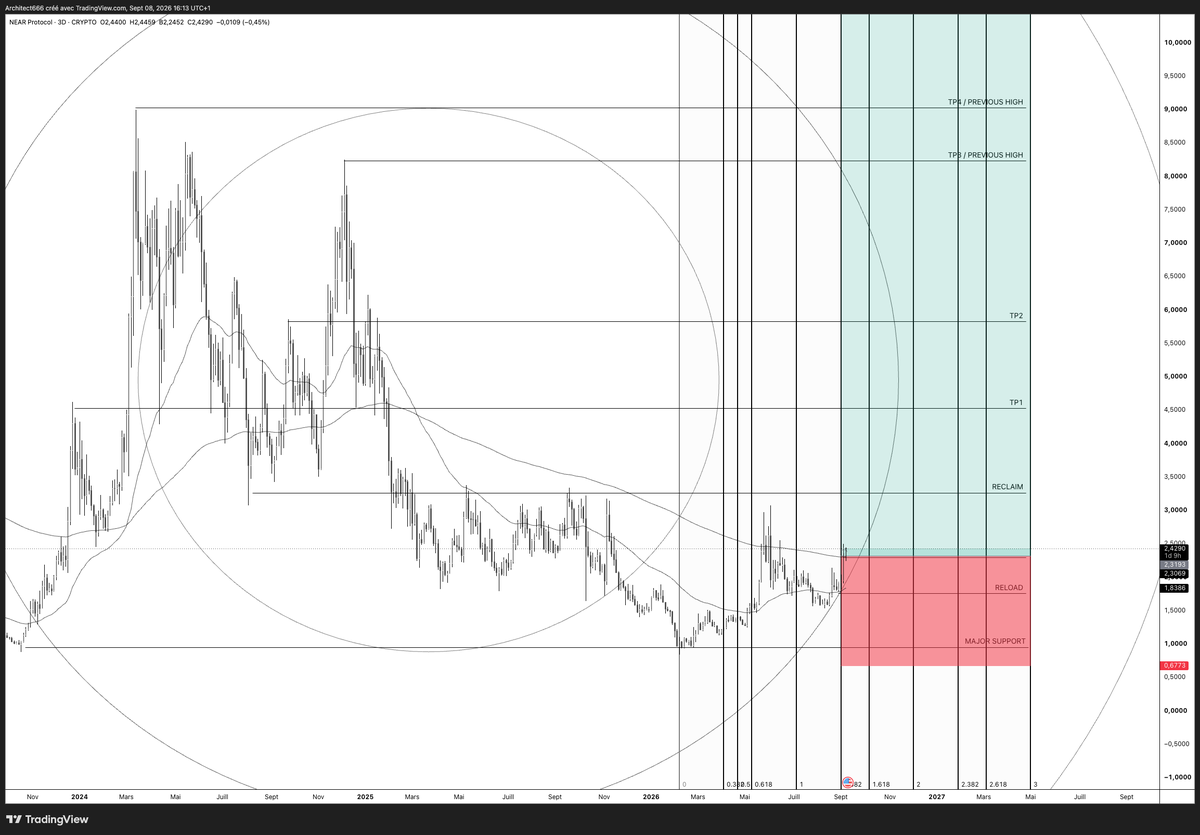
near:native — +43% since the call. 🚀
This setup is starting to deliver exactly what I was looking for.
NEAR has now moved roughly +43% from the entry zone, with another strong push today and price accelerating toward the next major reclaim area.
What I like most is that this doesn’t look like an isolated wick anymore.
The structure is expanding, momentum is building, and NEAR continues to show the relative strength I had already noticed during the smaller alt rebounds earlier this year.
Still plenty of work to do.
But if the broader alt rotation continues, I still think NEAR has room for a much larger repricing move.
No need to overmanage a working setup.
Let the winner run.
near:native — Starting to look ready. 👀
After spending most of 2026 rebuilding from the lows, NEAR is finally showing a meaningful change in structure.
Price has pushed back above the key moving averages, momentum is improving, and the latest move looks more like expansion than another dead-cat bounce.
The macro chart is still damaged, so this isn’t a confirmed full reversal yet.
But compared with where NEAR was a few months ago, the setup is becoming much cleaner.
Hold the breakout → continuation gets interesting fast.
No chase. Let the structure confirm.
$TOTAL — Failed breakdown for now. 👀
The lower Bollinger Band was tested aggressively following a pretty hostile macro backdrop: the Senate failed to advance the CLARITY Act, while the Fed delivered a 25 bps rate hike to 3.75–4.00%.
Yet the bears struggled to get meaningful follow-through.
BTC held up surprisingly well, and many alts are already recovering losses — some are even pushing beyond their previous levels.
For now, I’m treating the move below the lower Bollinger Band as a failed breakdown attempt, not a confirmed bearish expansion.
The level I’m watching next is the upper band around ~$2.71T.
A clean break there would be far more interesting and could finally give us the volatility expansion we’ve been waiting for.
My bias remains bullish.
But Bollinger compression only tells us a move is coming — price still has to choose the direction.
$TOTAL — Something is loading.
Daily Bollinger Bands are tightening fast.
A Bollinger squeeze doesn’t predict direction — it tells us that volatility is compressing and a larger move is likely approaching.
For now, structure gives me a slight bullish bias.
TOTAL is still defending the ~$2.56T local support while compressing directly beneath the ~$2.71T expansion level.
Hold here → pressure keeps building for a move north.
Break ~$2.71T → the path toward $3.3T starts opening again.
Lose the current structure → my ~$2.42T correction zone remains very much alive.
BTC is telling a similar story: liquidity remains on both sides, with shorts above and longs below waiting to be cleaned.
My current scenario?
A squeeze north first wouldn’t surprise me at all.
Take the liquidity above, convince everyone the breakout has started… then potentially come back later for the deeper $70–74K BTC reset everyone was waiting for in the first place.
This week has real catalysts too: FOMC on Wednesday, while the CLARITY Act begins its next Senate procedural step on Tuesday.
Compression is here.
Now we wait for expansion.
$TOTAL3 — Golden Cross confirmed on the Daily. 🚀
Quick reminder: TOTAL3 = total crypto market cap excluding BTC and ETH.
In other words, it’s one of the cleanest charts to track what the broader altcoin market is actually doing without the two giants distorting the picture.
And right now, the structure keeps improving.
After months of destruction, TOTAL3 has reclaimed its major moving averages, both are now turning higher, and the Daily Golden Cross is finally printing around the ~$730B area.
Meanwhile, market cap is already pushing around $780B.
That doesn’t guarantee a straight line up — nothing does — but combined with what we’re seeing across individual alts, this is another strong sign that the market is changing character.
BTC is waking up.
ETH is waking up.
And now the broader alt market is starting to participate.
The rotation is getting harder to ignore. 👀
bitcoin:native
As we mentioned on Monday, the Fibonacci structure indicated that Thursday and Friday would be an interesting window for BTC, with the $83,000–$84,000 range falling precisely at the next major confluence.
Yesterday was altcoin day, with some of them making some nice moves.
Today, BTC seems poised to take light again.
The price is climbing back toward $77,500, and if this turns into a genuine breakout rather than another false signal, the path toward the previous local high—and potentially toward the $83,000 to $85,000 liquidity zone we’re tracking—becomes very interesting.
My opinion hasn’t changed:
A push to the North remains my preferred scenario.
We already know the levels.
Now let’s see what BTC is ready to do today 🥷🏻
bitcoin:native — Interesting Fibonacci confluence into the end of the week 👀
I’ve been tracking these Fib circles from the ~$126K top down to the 2026 lows (57,7K), and something interesting is lining up around Thursday/Friday.
The next geometric intersection lands almost exactly in the $83–84K area:
• Fib retracement 0.382 → ~$84.0K
• Previous local high → ~$82.8K
• Short liquidity we identified → ~$85K
That’s a pretty dense cluster.
Does a Fibonacci circle mean BTC has to be there this week? Absolutely not.
But combined with the liquidation map, current compression and the structure we’ve been following, it reinforces my preferred scenario:
Hunt liquidity north first → then potentially retrace deeper later.
This week also brings real headline risk: the FOMC meets Sept. 15–16, with the rate decision Wednesday, while the Senate’s next procedural step on the CLARITY Act is scheduled for Tuesday.
But I’m careful about building trades around headlines alone.
Markets front-run events.
Bullish news can sell off.
Bad news can get absorbed.
Sometimes the move was already priced before the headline even arrived.
So I’m watching price first.
$83–85K remains the northern magnet on my board.
My bias: north first, south later.
Let’s see if Fibonacci wants to show off again.
near:native — The setup is starting to print. 👀
NEAR is now roughly +25% from the entry zone, and the structure is developing almost exactly the way I wanted to see it.
This one has been on my radar for a while. Even during the smaller altcoin rebounds earlier this year, NEAR was already showing signs of relative strength and waking up faster than a lot of the market.
Now the environment is getting much more interesting.
Altcoins are starting to move one after another, broader market structure is improving, and NEAR is accelerating out of its base with real momentum.
Quick context: NEAR is a Layer 1 built around scalable sharding and developer-friendly infrastructure, so there’s an actual ecosystem and technology behind the token — not just a narrative.
Obviously +25% is only the beginning of the roadmap.
But if this broader alt rotation really develops, I think NEAR has the structure to produce a much larger repricing move.
near:native — Starting to look ready. 👀
After spending most of 2026 rebuilding from the lows, NEAR is finally showing a meaningful change in structure.
Price has pushed back above the key moving averages, momentum is improving, and the latest move looks more like expansion than another dead-cat bounce.
The macro chart is still damaged, so this isn’t a confirmed full reversal yet.
But compared with where NEAR was a few months ago, the setup is becoming much cleaner.
Hold the breakout → continuation gets interesting fast.
No chase. Let the structure confirm.
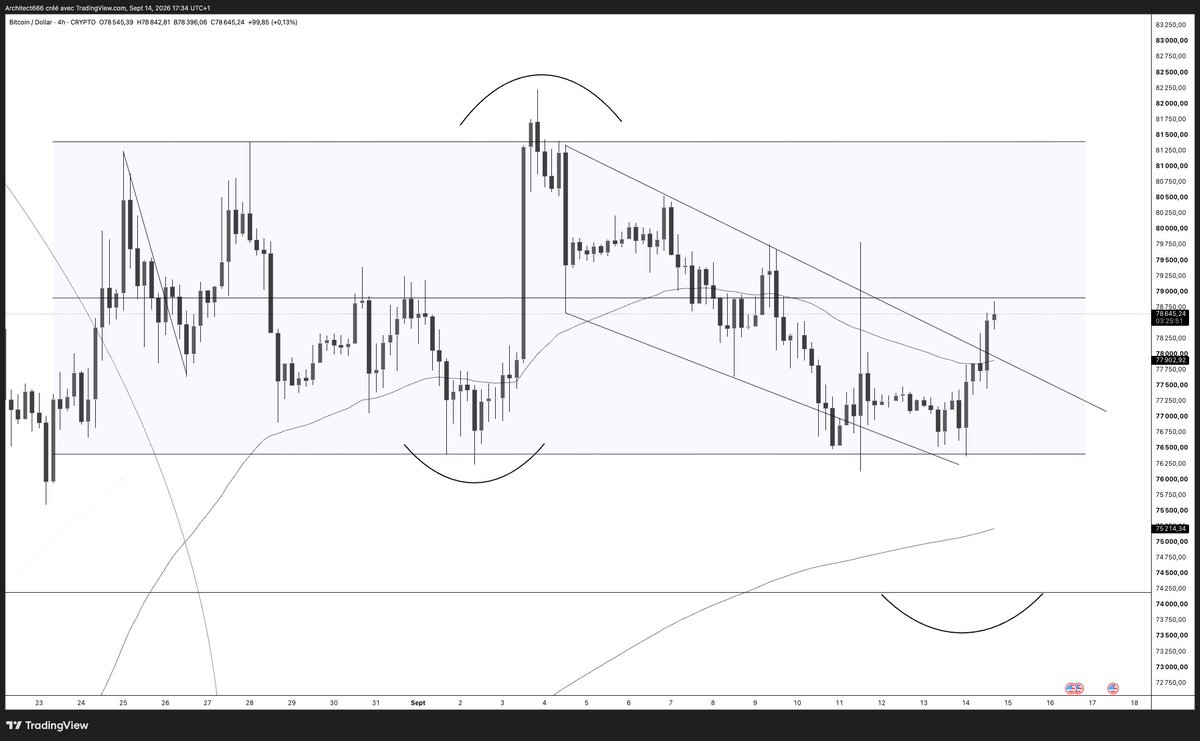
bitcoin:native — Attempting to break out. 👀
BTC is still trapped inside the broader range, but the short-term structure is starting to improve.
Friday’s macro volatility gave us exactly the kind of price action these events often produce: expansion in both directions, liquidity taken on both sides, followed by a full re-entry into the range.
Today, since the US session opened, BTC has finally pushed above the falling wedge that has been controlling price since the early-September high.
That’s constructive — but not confirmation yet.
We’re trading around $78.6K, and the real test is now whether BTC can hold above the broken trendline and start reclaiming the upper part of the range.
If it does, my north-first scenario remains very much alive, with the $83–85K area becoming increasingly interesting.
If price immediately falls back inside the wedge, then we probably just witnessed another fakeout and the range continues doing what ranges do: frustrating everyone.
Wedge breakout ≠ range breakout.
But for now, buyers are finally making an attempt.
Let’s see if they can follow through.
bitcoin:native — Interesting Fibonacci confluence into the end of the week 👀
I’ve been tracking these Fib circles from the ~$126K top down to the 2026 lows (57,7K), and something interesting is lining up around Thursday/Friday.
The next geometric intersection lands almost exactly in the $83–84K area:
• Fib retracement 0.382 → ~$84.0K
• Previous local high → ~$82.8K
• Short liquidity we identified → ~$85K
That’s a pretty dense cluster.
Does a Fibonacci circle mean BTC has to be there this week? Absolutely not.
But combined with the liquidation map, current compression and the structure we’ve been following, it reinforces my preferred scenario:
Hunt liquidity north first → then potentially retrace deeper later.
This week also brings real headline risk: the FOMC meets Sept. 15–16, with the rate decision Wednesday, while the Senate’s next procedural step on the CLARITY Act is scheduled for Tuesday.
But I’m careful about building trades around headlines alone.
Markets front-run events.
Bullish news can sell off.
Bad news can get absorbed.
Sometimes the move was already priced before the headline even arrived.
So I’m watching price first.
$83–85K remains the northern magnet on my board.
My bias: north first, south later.
Let’s see if Fibonacci wants to show off again.
bitcoin:native — Liquidity on both sides.
The liquidation map is giving us two very obvious magnets right now.
On the 10x map, the biggest clusters sit around:
• ~$85K above → short liquidations
• ~$70.25K below → long liquidations
So the question isn’t really whether liquidity gets hunted.
It’s which side goes first.
The obvious consensus right now seems to be a move lower: retest the Daily Golden Cross around ~$72.9K, sweep $74K / $72K / $70K, then continue.
And that’s exactly why I’m still open to the opposite sequence.
Squeeze the shorts first → attack ~$85K → make everyone chase the breakout → then come back later for the deeper reset.
Could absolutely happen the other way around too.
Wait and see.
$TOTAL — Something is loading.
Daily Bollinger Bands are tightening fast.
A Bollinger squeeze doesn’t predict direction — it tells us that volatility is compressing and a larger move is likely approaching.
For now, structure gives me a slight bullish bias.
TOTAL is still defending the ~$2.56T local support while compressing directly beneath the ~$2.71T expansion level.
Hold here → pressure keeps building for a move north.
Break ~$2.71T → the path toward $3.3T starts opening again.
Lose the current structure → my ~$2.42T correction zone remains very much alive.
BTC is telling a similar story: liquidity remains on both sides, with shorts above and longs below waiting to be cleaned.
My current scenario?
A squeeze north first wouldn’t surprise me at all.
Take the liquidity above, convince everyone the breakout has started… then potentially come back later for the deeper $70–74K BTC reset everyone was waiting for in the first place.
This week has real catalysts too: FOMC on Wednesday, while the CLARITY Act begins its next Senate procedural step on Tuesday.
Compression is here.
Now we wait for expansion.