Dear Data Analyst/Scientist.
Read these books and you'll be miles ahead in your Data journey.
To get it:
1. Follow me (so I can DM you)
2. Like and retweet
3. Reply with "Data"
The Ultimate AI PM Learning Roadmap
An extended edition with dozens of resources: definitions, courses, guides, reports, tools, and step-by-step tutorials 🧵
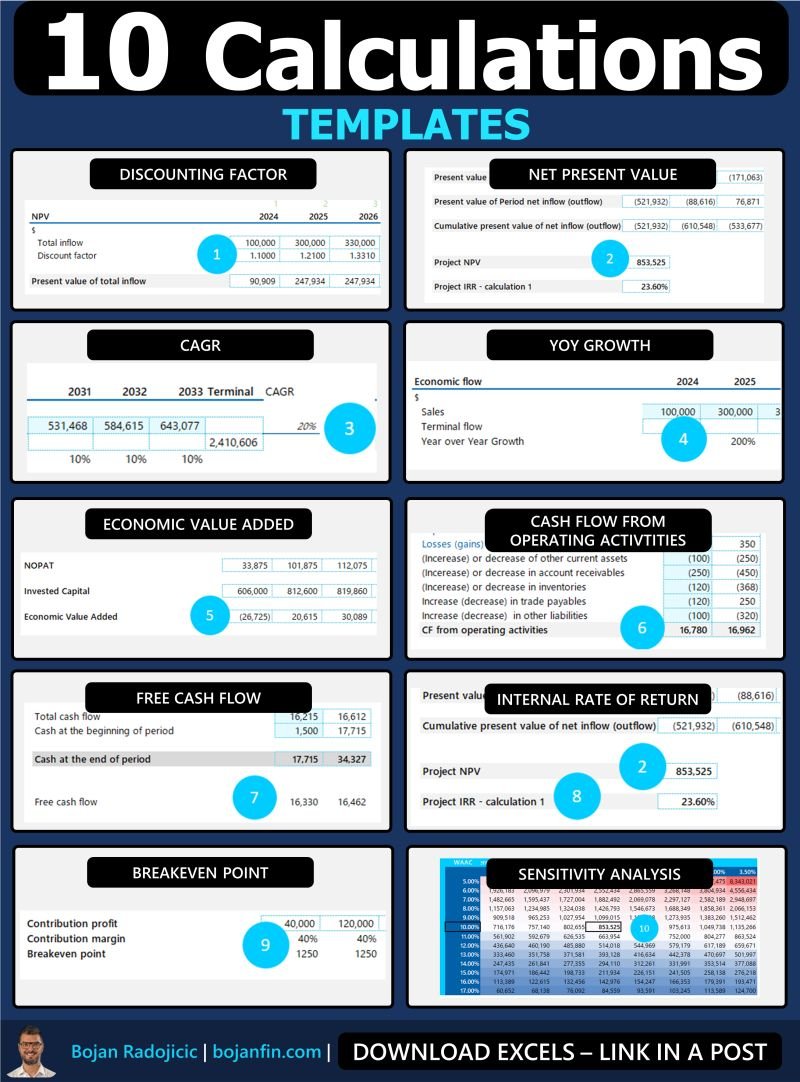
📊 10 Calculations in one Excel!
Here’s what’s inside:
🔹 CAGR
🔹 Break-even Point
🔹 YoY Growth
🔹 Discounting
🔹 Net Present Value (NPV)
🔹 Cash Flow from Operating Activities
🔹 Free Cash Flow
🔹 Economic Value Added (EVA)
🔹 Discounting Factor
🔹 Internal Rate of Return (IRR)
All these calculations in one Excel file to boost your financial modeling skills! 🚀
Drop a comment and I will send you the Excel! (follow me so I can DM you).
Visualizing complex data can be challenging, but Principal Component Analysis (PCA) offers a powerful solution. By reducing the dimensionality of data sets, PCA not only simplifies the data but also uncovers hidden patterns that can be missed in the maze of high-dimensional data. Let's explore how PCA transforms data visualization:
From Complexity to Clarity 🔄
- What It Does: PCA reduces data to two or three principal components, making it possible to visualize complex data sets on a 2D or 3D plot.
- Why It's Helpful: It allows us to see the big picture, revealing relationships, clusters, and variances in data that were not apparent before.
Highlighting the Essentials 🔦
- How It Works: By focusing on components that account for most of the variance, PCA ensures that the most informative features of the data are highlighted in the visualization.
- Benefits: This makes it easier to identify patterns, trends, and outliers, providing clear insights into the data's structure.
Enhanced Decision Making 🎯
- Impact: Visualizations simplified through PCA provide a more intuitive understanding of the data, supporting better, data-driven decision-making.
- Applications: From market research to genomic studies, PCA-enhanced visualizations are invaluable in countless fields.
Embrace the power of PCA for your next data visualization project and turn complex data sets into insightful, easy-to-understand visuals.
Want to master PCA and elevate your data visualization skills using the R programming language? I've crafted an extensive course exploring both the theoretical aspects of PCA and its practical use in R programming.
More details are available at this link: https://t.co/DUfoAHuxxD
#RStats #statisticians #R4DS #Data #DataScience #datastructure