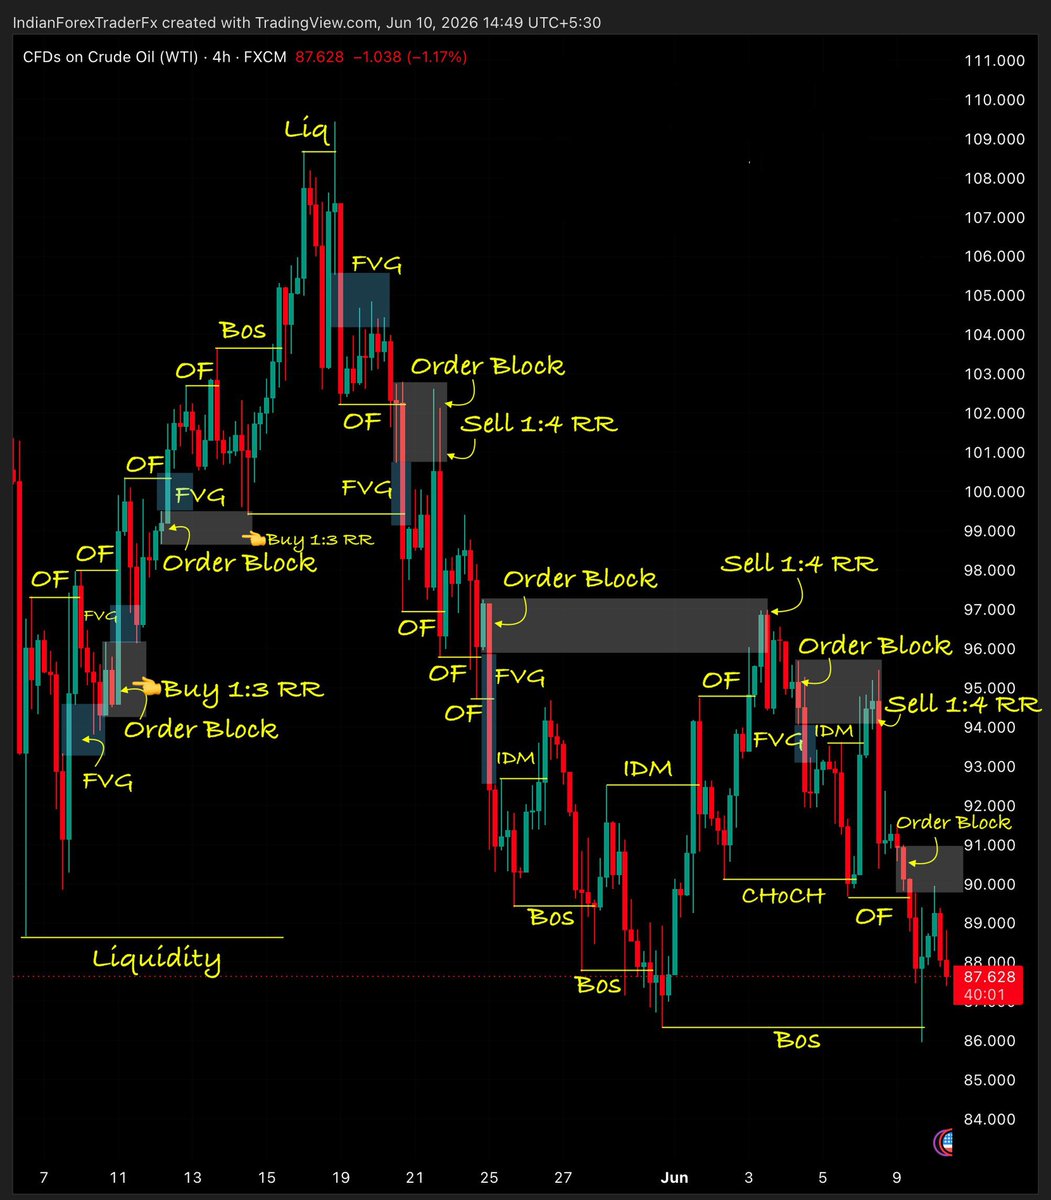
TRADE THE CHART, NOT THE COLORS.
Red and green candles create unnecessary psychological pressure.
Your brain starts reacting to the color instead of the structure.
Switch to neutral candles and the emotional noise drops immediately.
You stop fighting the last candle and start reading the actual order flow.
Better decisions.
Multi-timeframe analysis done properly
Start on the 4H.
Determine direction, mark key levels, and identify supply & demand zones.
Drop to the 1H.
Confirm the trend, look for breaks or reversals, and map Order Blocks, FVGs, and liquidity.
Only then move to the 15-minute chart.
This is where you wait for final confirmation before entering.
4H gives you the bias.
1H gives you the setup.
15-minute gives you the trigger.
Simple 5scalping exercise
1. Open a 5-minute chart
2. Wait for a clear high to form and mark it
3. Wait for a clear low to form and mark it
4. Watch price climb back toward the previous high
5. If it rejects or fails the breakout → Short
6. Target the low you marked
7. Stop loss sits above the highs
Same process works in reverse for longs.
No indicators.
No overthinking.
Just structure, reaction, and a fixed target.
Practice this on replay until the sequence becomes automatic.
BOS vs CHoCH
BOS = Break of Structure
It signals continuation.
In an uptrend, price must break the previous higher high.
In a downtrend, price must break the previous lower low.
When that happens, the trend is still intact.
CHoCH = Change of Character
It signals the first sign of a possible reversal.
In an uptrend, when price makes a lower low below the previous higher low → CHoCH.
In a downtrend, when price makes a higher high above the previous lower high → CHoCH.
BOS keeps you with the trend.
CHoCH warns you the trend may be shifting.
One continues.
One challenges.
Don’t chase the breakout.
When price breaks structure, the direction is confirmed.
But that candle is rarely the entry.
Smart money doesn’t buy the spike.
They wait for price to return and retest the broken level — often into the Fair Value Gap left behind.
That retest gives you:
• A defined invalidation
• A tight stop
• Much better risk-to-reward
The breakout tells you the bias.
The retest gives you the trade.
Strong & Weak Swing Points
A swing high or low has one job: produce a Break of Structure in the next swing.
- If it does → Strong
- If it fails → Weak
Strong points are protected.
We expect price to respect them.
Weak points are targeted.
We expect price to take them out.
In an uptrend
Strong lows (Higher Lows) hold.
Weak highs (Higher Highs) get taken.
In a downtrend
Strong highs (Lower Highs) hold.
Weak lows (Lower Lows) get taken.
Trade in the direction of the strong points.
Target the weak ones.
Structure tells you what is protected and what is next.
Imbalance Types.
Normal Imbalance
Aggressive buying leaves a gap between the high of candle 1 and the low of candle 3.
Price often returns to fill the imbalance before continuing in the original direction.
Inverse Imbalance
A strong opposing candle creates an imbalance against the prior move.
This zone frequently acts as a retest level before price continues in the new direction.
Combined (Inverse + Normal)
When both appear together, the inverse imbalance and the normal imbalance sit side by side.
This confluence often creates a high-probability reaction zone.
Imbalances are not just gaps.
They are areas of unfinished business.
Price tends to revisit them.
How it reacts when it gets there tells you the next move.