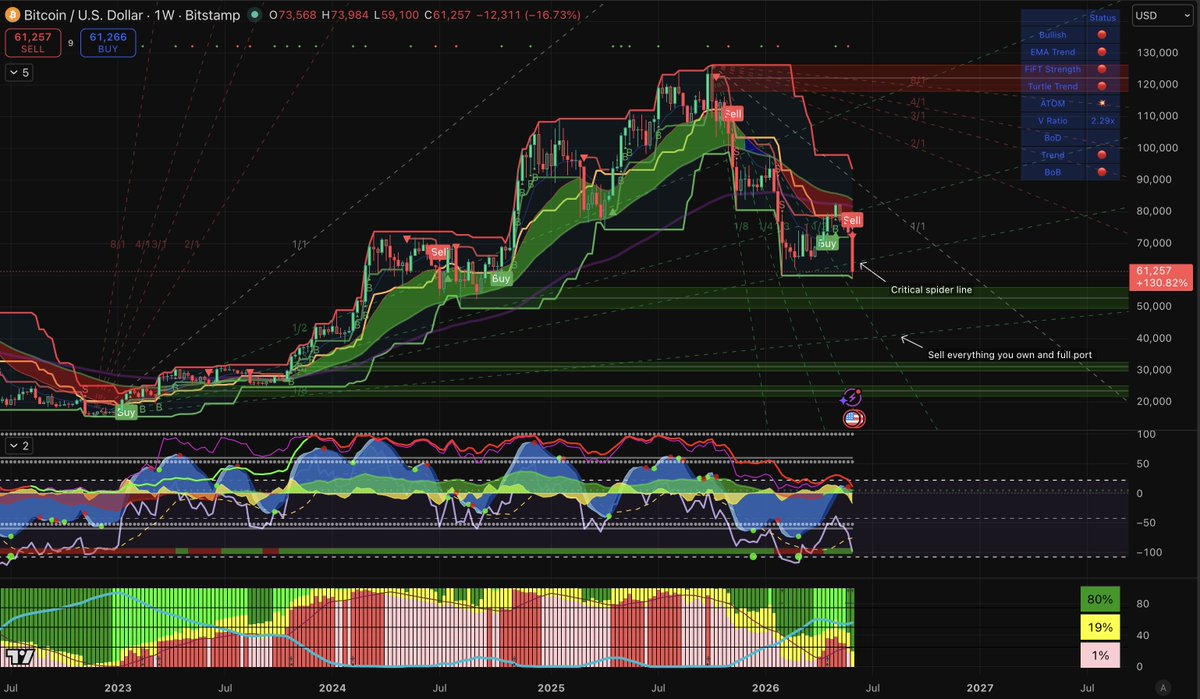
BTC Weekly Chart
Nobody wants to say it so I will.
If BTC loses this level, $40,000 is the big bounce area.
EMA Trend: expanding to the downside.
Market Cipher B: setting up for a potential gigga dump.
Whale Indicator: 1% red bars which means no big money in sight. 77% green which means retail is driving and that's never bullish.
The ONLY good news: historically when whale bars go to zero, we're close to a bottom.
But close to a bottom and AT the bottom are two very different things.
What's your target if this support level breaks?
Bitcoin 1HR & 4HR Kingfisher Data Charts
1HR View:
BTC has been grinding up, but perp CVD is still pretty negative while spot CVD is only slightly negative. That tells me perps have been fading this push while spot has quietly supported it. Spot and perp delta are both green, so intraday buyers are stepping in, but the bigger picture flow is still net sold. Premium is still negative, so perps are trading under spot and shorts are pretty comfortable here.
4HR View:
Zooming out, total CVD is still strongly negative with both spot and perp CVD deep in the red. That’s a lot of previous distribution the market has to chew through. The 4h deltas have finally flipped positive, so buyers are showing up, but they’re doing it against a heavy spot selling backdrop. Premium is still negative on the 4h as well, which fits a market that’s leaning short and cautious instead of FOMO long.
My Takeaway:
On the 1h, buyers have the ball and can probably squeeze us a bit higher, but on the 4h it still looks like a relief rally inside a larger spot driven downtrend. For now I’m more interested in selling strong bounces than assuming this is a clean trend reversal.
Bitcoin 4HR Chart (Mid-Timeframe View)
Things are starting to look interesting here.
Spider Lines: For now, local bottom confirmed last Friday when price hit $59,000. This indicator auto-creates spider lines at the bottom fulcrum (fanning up) and at the top fulcrum (fanning down).
EMA Trend: Red, but it looks like it's stopped expanding downward, which is good. Tells me BTC is trying to stabilize here. Want to see these start to tighten up before I feel better about this move.
Market Cipher B: RSIs trying to curl up. Money flow still red but trying to climb out of it, heading the right direction. Momentum waves possibly bottomed (good), and we've got a green dot here, which is bullish for the move up. Looking okay.
Whale Indicator: Pretty even across the board, slightly more red bars, which is what we want (red > green). Need a lot more red % before getting excited. Positive: since the drop to $59K, red bars have been slowly increasing. Something's cooking here.
Thinking about doing a perp trading challenge where I upload like 1k and take that bitch to 100k live
So tons of scalping on small timeframes
What do you guys think about dis ?
Bitcoin 4HR KingFisher Data Chart
CVDs (spot, perp, total)
- Spot CVD ~ 6.6B: spot has been net sold. That’s real BTC getting dumped, not just perp games. Bulls don’t have spot on their side right now.
- Perp CVD ~ 8.1B: perps are even more sold. Aggressive shorts and long closing are driving a lot of this move.
- Total CVD ~ 14.7B: combining them, it’s a pretty solid wall of selling over the period. This move is “earned” by flow, not a random wick that’s begging to be retraced.
Delta (spot vs perp)
- Spot delta ~ 8M: spot orderflow is still tilted sell. No obvious big buyer soaking this yet.
- Perp delta ~ 161M: way more negative than spot. Derivatives traders are the ones leaning hard – they’re shorting into bounces or puking longs, not nibbling long.
Liquidations
- Short liq: Small. We haven’t had a meaningful short squeeze on the recent bounce attempts – shorts are pretty comfortable.
- Long liq: You can see a trail of long liquidations on the way down. Every bounce buyer keeps getting rinsed, which fits a trending down tape more than a reversal zone.
Premium index
− 26: Perps are trading below spot. That’s classic bearish positioning – the market is fine being short and is effectively giving a discount to anyone willing to be long.
- As long as premium sits that negative, it’s hard to argue for a strong, sustained squeeze unless something changes fast.
Big Picture
- We’ve already had a strong dump and now BTC is just kind of drifting under the prior range, not really snapping back.
- Nothing in the flow panel is screaming “bottom is in” yet.
-It looks more like controlled selling and distribution.
Thinking about renting a penthouse in Miami for a month with @RealCryptoFace and streaming 24/7 on @kick
Live trading all day
Partying all day
Inviting other Crypto bros to pull up
Nobody in the CT space is crazier than us two lol
This would be the most lit live stream & entertaining no doubt