Follow for cross-asset charts no one else can make
BTC vs Pokemon 📊 NFTs vs Gold, Pre-IPO vs Crypto
Building @OmniaChart — chart anything vs anything.
· NFA
2/ The $BTC/pokemon_psa_total_mc chart suggests that the ratio might go back between 25-50.
This aligns with the anticipation of an alt season and a risk-off environment, which could catalyze a massive influx into Pokemon cards via tokenization.
The prediction here is a final extended wave of mania driven by nostalgia and renewed interest in the Pokemon franchise.
This is a reconstruction of the Pokemon PSA cards market cap using data points of prices and pops of the main cards.
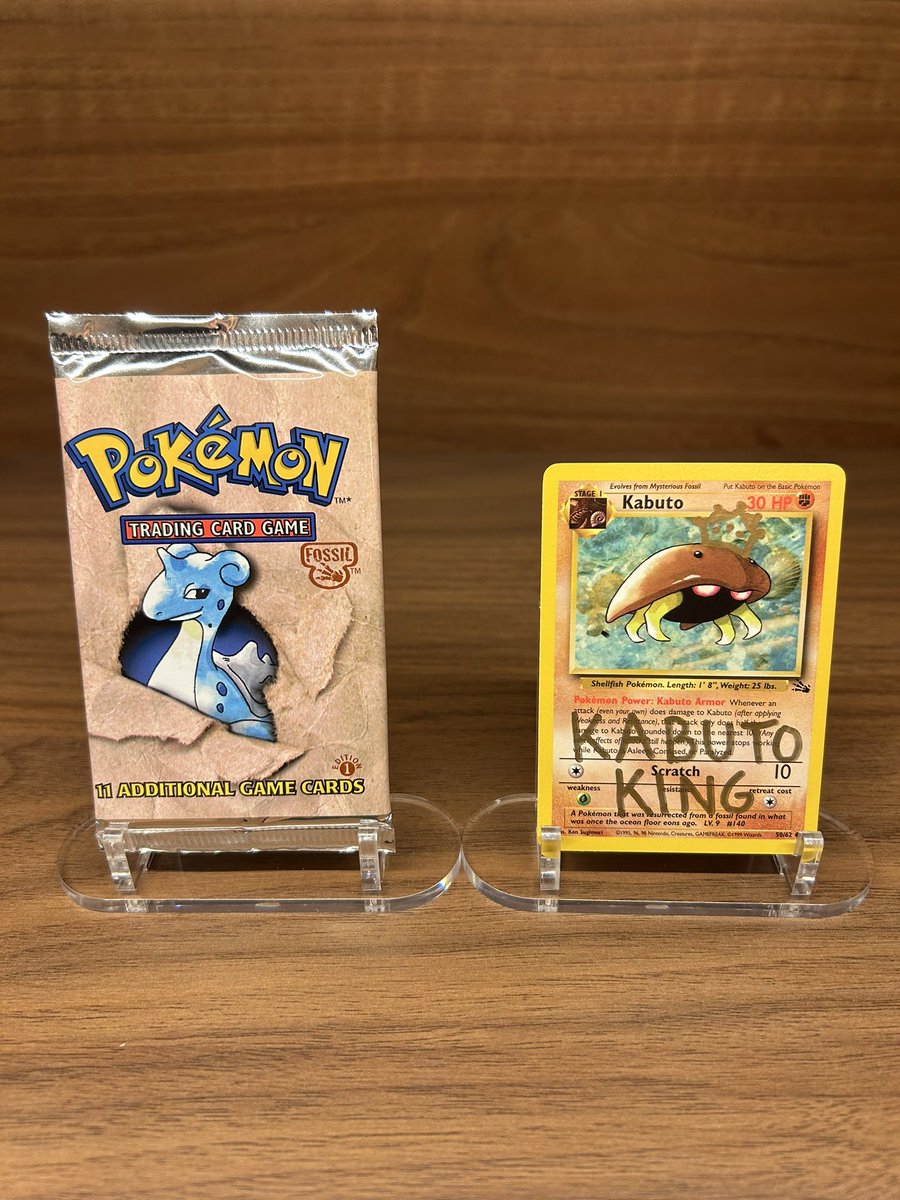
KABUTO KING GIVEAWAY 👑
To celebrate the collection reaching 5000 Kabutos I am giving away…
Winner Receives:
👑 1st edition Pokemon Fossil Pack
👑 Signed unlimited fossil Kabuto
How to Win:
- Quote this post with “Kabuto is King 👑”
- Follow @KabutoKing_
A winner will be picked Tuesday evening. Good luck and thank you all!
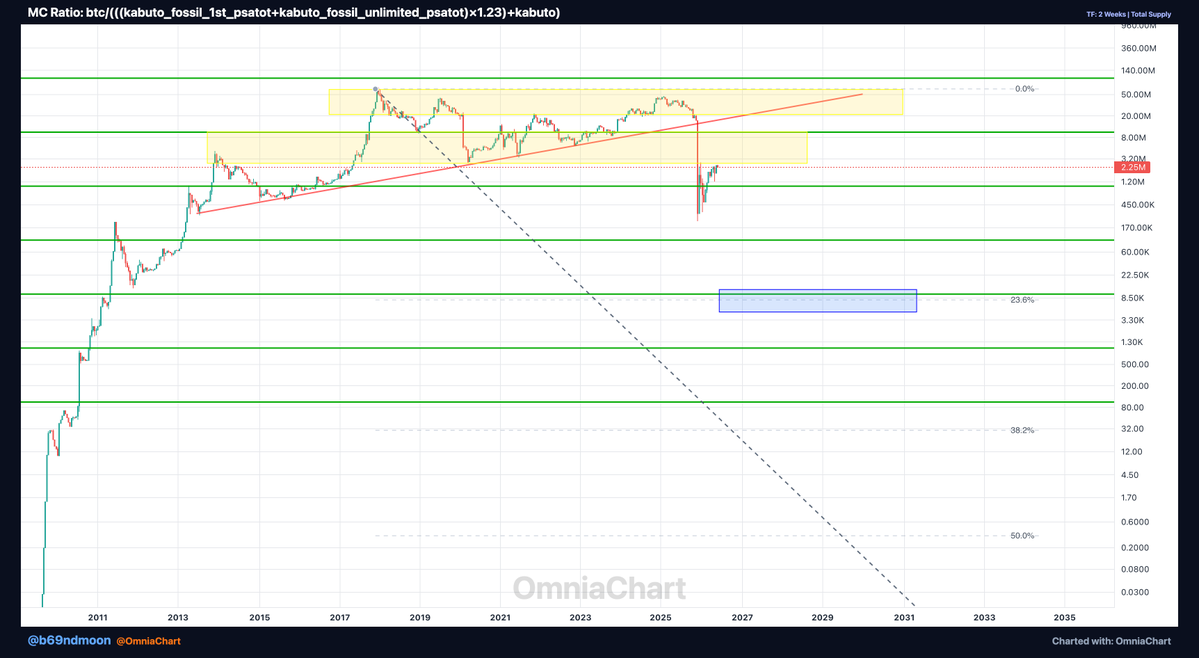
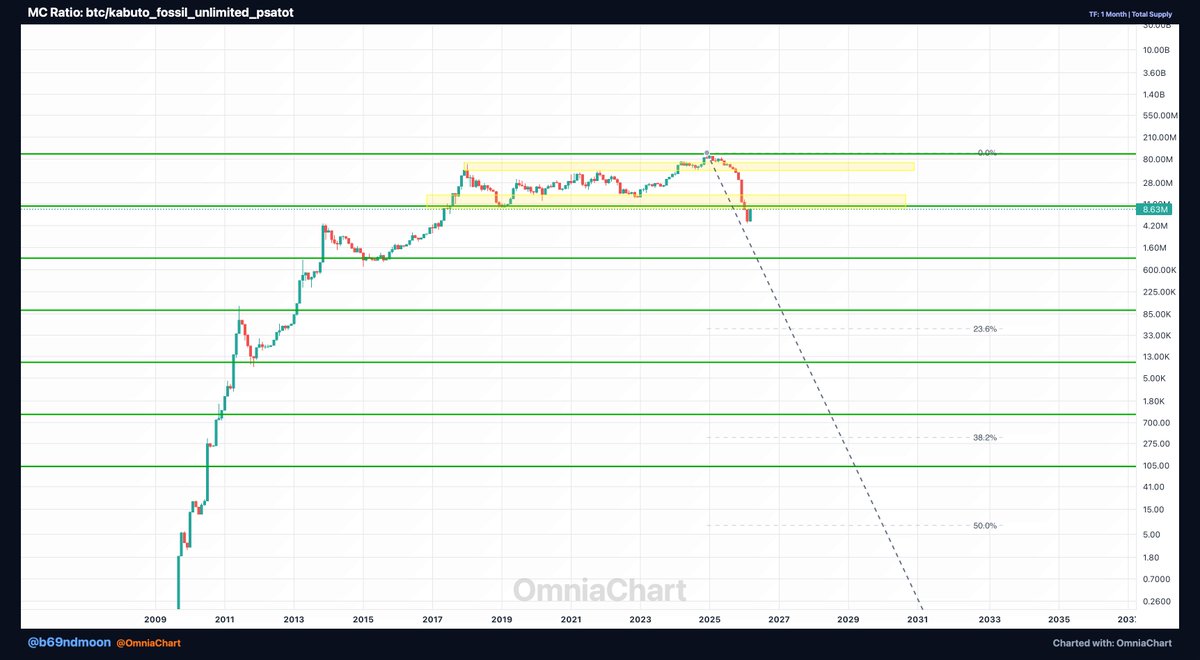
$BTC is 10Mx bigger than all Kabuto fossil Unlimited Pokémon cards combined.
At peak that ratio hit 100M. Now under 10M — already a 10x compression as Kabuto appreciated. Currently sitting just under a multi-year distribution range.
If this breaks toward 1M, that's another 100x compression. Kabuto closing real ground on BTC market cap.
Absurd chart. Real data.
#Pokemon #CrossAsset
Charizard's total market cap has been holding above the top of its macro range vs MicroStrategy.
MicroStrategy has $MSTR on every portfolio manager's radar. Charizard, especially vintage ones, have 30 years of scarcity, and interest in collectibles investments is skyrocketing.
Weird comparison? Maybe. But what matters is comparing 2 of the best performing assets in recent years.
@OmniaChart
#Charizard #CrossAsset
@ActuFoot_ Adding the macro lens: Rolex Daytona / Gold kg ratio sitting at lower channel boundary, wave 4 close to bottom. The watches-vs-physical-gold ratio is mean-reverting setup. Charted on @OmniaChart: https://t.co/YSdTZotbVt
Rolex Daytona wrt Gold kg price — wave 4 close to a bottom at lower boundary of the channel!
Luxury watches vs physical gold. Most people wouldn't think to chart these two, but I think it's a bit like charting NFTs wrt BTC or ETH. Wave 5 target is 1-2x a kg of gold for a Daytona — sounds absurd until you look at where it's been before, with that top around 0.7-1 around 2000.
$XAU running its supercycle while Rolex sits depressed in ratio terms. Could be a slow wave 5 setup over the next 10-20 years. Worth watching if you want a long term beta play of gold!
#Rolex #Gold
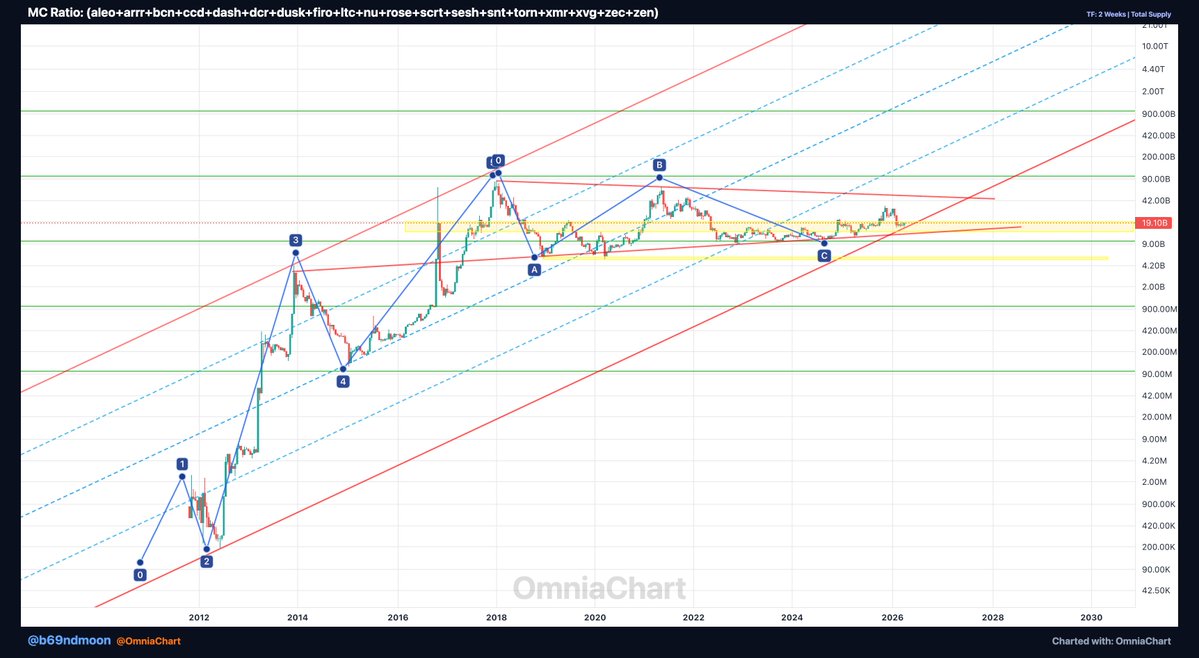
@BobLoukas XMR catalyst ties into the bigger sector view: 20 privacy coins combined MC held the $10B floor through the cycle and is now coiling in a bullish pennant. 2018 top was $100B = 10x setup. Charted on @OmniaChart: https://t.co/uTh3jLnM7S
20 privacy coins. Total sector MC held $10B through the worst of the cycle — and is now forming a massive bullish pennant.
Reaccumulated above $10B since 2022. Top in 2018 was around $100B. If this pennant resolves up, next technical target is $100B and potentially $1T — wave 3 scenario.
Privacy narrative tends to perform well when macro gets uncomfortable, which is without doubt the current moment. The chart is at the exact setup.
$XMR #Privacy
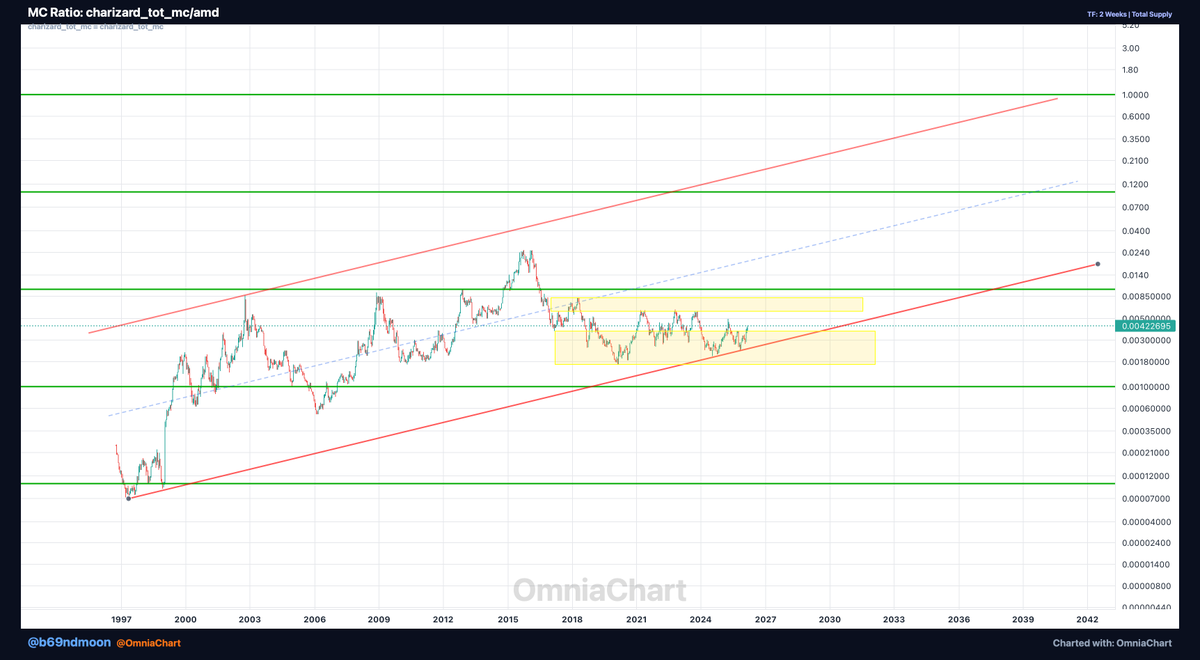
@aakashgupta Beyond single-card analysis: Charizard total market cap (every version + every grade) vs $AMD has been accumulating for 9 years. Something loading at this level. Charted on @OmniaChart: https://t.co/XoRgCegDgn
Charizard total market cap vs $AMD — 9 years of accumulation. Something is loading.
Every version, every set, every major graded and raw card summed to have an estimate of the character's marketcap. The ratio has sat in this range since 2016. An exit from here would be the first structural break since before even the NFT cycle in 2021.
Not a lot of people chart Pokemon cards, i like to see macro cycles trends unfolding, rotations across narratives.. that's why I think it's important comparing performances across different and unrelated asset classes, especially wrt to best performing assets, like in this case AMD stock, or in other charts as I did with NVDA.
$CHARIZARD #NFT #Collectibles #PokemonCards
@CryptoMichNL On valuation: $ARB / $SOL MC ratio at 0.01x = range low. ABC correction complete, range top is 0.33-0.5x SOL MC. Setup either launches here or stays compressed. Charted on @OmniaChart: https://t.co/OVJoG8TXK1
$ARB MC almost at 0.01 of SOL's, at range low.
ABC correction looks complete. C wave either launches from here toward 0.33–0.5 of SOL MC (range top), or it fails this level and stays compressed, sending the ratio to 0.0033 or so.
If L2 narrative rotates back in, this ratio moves fast.
#L2 #ARB #Solana #Crypto
Rolex market cap vs Gold market cap.
Ratio topped around 0.1 of Gold's MC around 2000 and since then it's been compressing on what appears a classic ABC, with C wave corresponding to the recent gold price increase in last years.
Most people don't think of watches as an asset class. But the collectible watch market has a measurable total market cap, and you can chart it against gold.
Currently watching whether this ratio holds its recent structure or gives back more ground to XAU. Holding here means starting a long term trend back towards 0.1 or even 0.25-0.33 of this ratio.
$XAU
#Rolex #Gold
5/ All of this is possible because @OmniaChart lets you build ratio charts across any two assets — NFTs, Pokémon cards, crypto, stocks...
Cross-asset analysis used to require Excel and prayer. Not anymore.
Try it free: https://t.co/jzF8s38Rkc
A CryptoPunk used to cost 10,000x a Kabuto Fossil PSA10.
Now it costs around 100x.
The Kabuto PSA 10 did a x100 in the price ratio between these two OG collectibles, will this ratio fall back to parity? crazy to think, but Kabuto King is leading the wave! $KABUTO
I charted 3 interesting ratios involving Pokemon and NFTs. Here's what they show:
#CryptoPunks
4/ $KABUTO memecoin + Kabuto Fossil 1st Ed cards (combined MC of both PSA cards and raws estimate) vs Charizard 1st Ed total MC.
Bottomed around 0.005. Now sitting under 0.033.
Kabuto's combined MC is still less than 3% of Charizard's graded card market. Same franchise, completely different valuations, can Kabuto meme culture make it back to parity? it would be a bit like DOGE reaching BTC marketcap.. all in Kabuto King hands!
#Pokemon
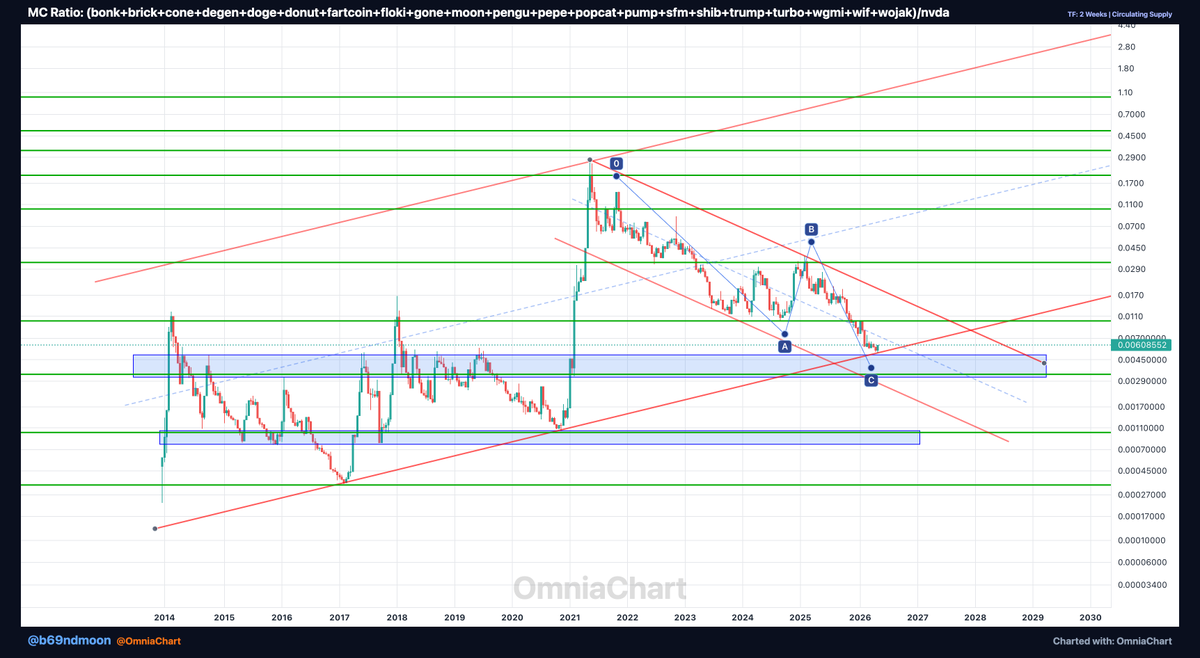
Total meme coin market cap vs NVDA — charted.
21 meme coins combined, measured against NVDA's market cap. This ratio hit 0.2 back in 2021. Then a full ABC correction unfolded. Now it's retesting the exact level of the accumulation range broken in 2021.
Ratio under 0.01. A decade-long boundary being re-tested right now.
If memes hold here and start recovering ground against NVDA, we're looking at a sector-wide shift. Memes will come back hard when no one expects it.
$DOGE
#Memecoins #NVDA
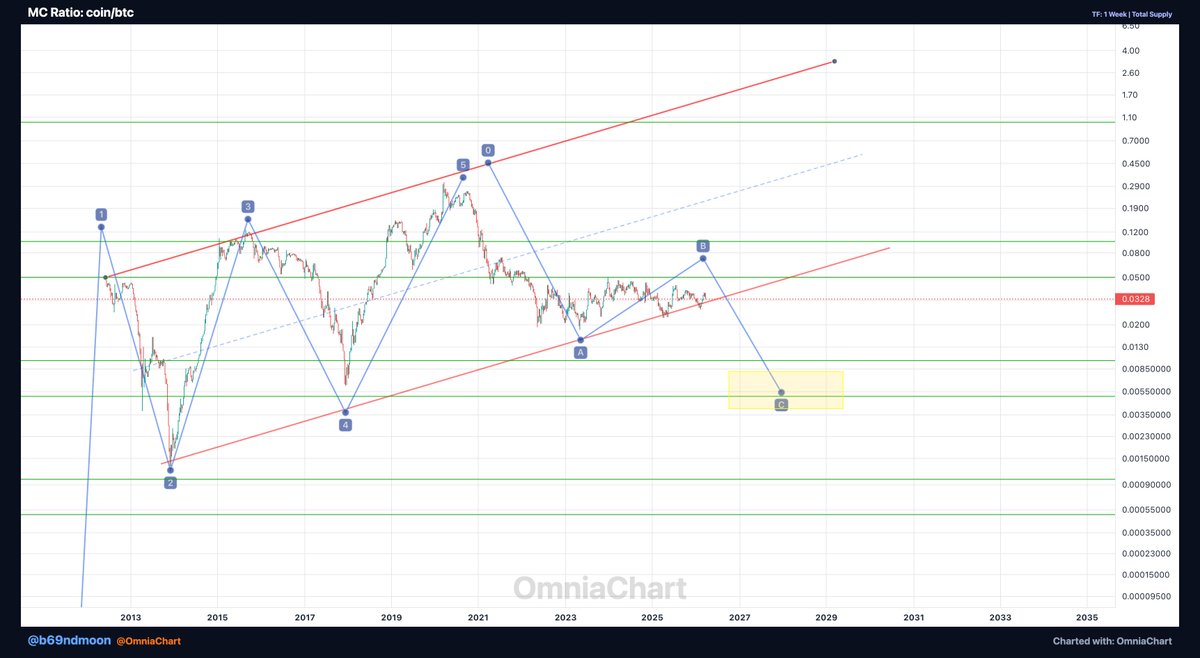
Coinbase/BTC market cap ratio hit roughly 0.01 in 2018, topped at 0.33 in 2020. I think a macro ABC is gonna unfold, and we might have an other push of this ratio from 0.0333 up to around 0.1... then macro C wave might unfold with a target 0.01-0.005 range on this ratio, at base wave 4. That's 50-80% lower from here.
COIN going up in USD doesn't change the story. BTC compounds harder. But in the medium term it might still act as a beta play.
$COIN
#BTC
5/ All 3 charts built on OmniaChart. You can chart $BTC vs Pokemon, Rolex vs gold, NFT sectors vs equities — anything against anything. Try it free: https://t.co/jzF8s38Rkc @OmniaChart
The $BTC/Pokemon ratio has been falling since 2017. Head & shoulders forming at the neckline right now. From ~200 → 10-20 is the thesis. 4 charts on why the collectibles market is quietly eating crypto's lunch:
4/ What these charts tell me: cards with fixed supply — 1st ed print runs from 1999, never reprinted — don't behave so much differently from $BTC. No new supply. Only new demand. In a speculative environment where NFTs will perform well, I think these cards will keep growing together!