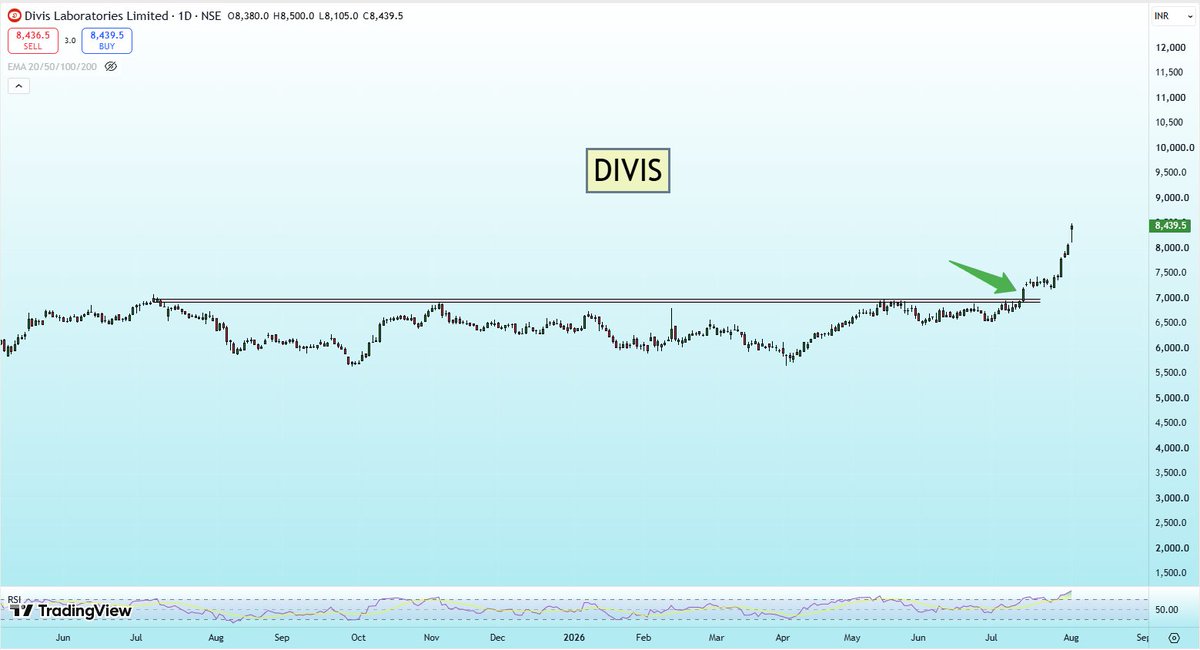
A breakout is easier to understand when you study what happens BEFORE it.
Look for these 4 clues:
Range contracts → candles become smaller
Volatility falls → price stops making large moves
Price gets compressed → buyers & sellers reach equilibrium
Expansion begins → one side finally takes control
The mistake?
Waiting for the breakout candle to tell you everything.
Study the compression first. The breakout is only the final act.
#stocks
Here are two scenarios I often look at after a breakout.
Scenario A: The breakout happens, and then the price makes a shallow pullback towards the 10/20 EMA. It spends a few days correcting, comes closer to the moving average, finds support and starts moving up again.
Scenario B: The breakout happens, but instead of pulling back, the price simply goes sideways. Since the 10/20 EMA is a fast-moving average, it slowly catches up with the price while the stock remains stuck in a range.
Both scenarios can work.
But I generally prefer Scenario A.
The reason, In A, the price is actually correcting and finding support near the EMA. In B, the price hasn't really made progress after the breakout. The EMA is only catching up because the stock has gone sideways.
For me, a controlled pullback to the EMA is usually a healthier sign than the EMA catching up to a stalled price.
#Trading
Looking for short-term swing trades?
Use the Momentum Stocks Scanner to easily spot stocks that are on the move! Perfect for catching those quick moves.
https://t.co/p1a8XrINNX
The market speaks in two languages:
Price and Volume.
Price tells the story. Volume tells you how many believe it.
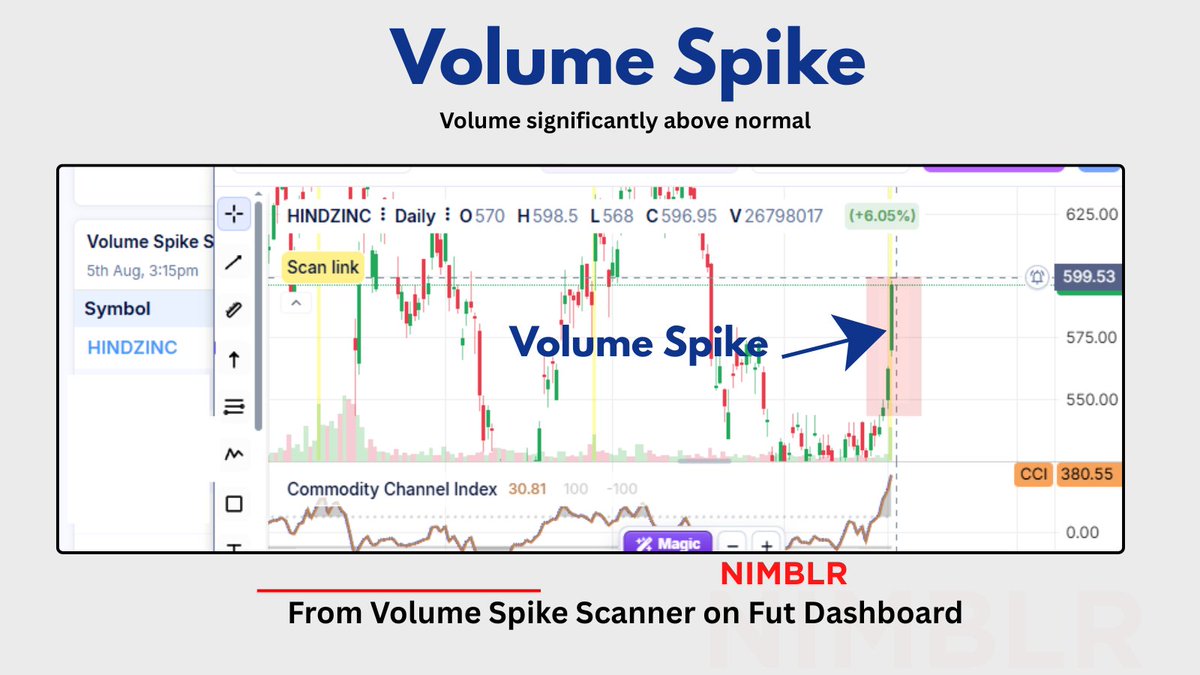
A Volume Spike tells me:
✅ Interest has increased
✅ Liquidity has improved
✅ Momentum may be building
✅ The stock deserves a closer look
Something has changed.
Maybe institutions are accumulating.
Maybe fresh news has arrived.
Maybe a breakout is about to begin
One of the scanners inside the Nimblr Fut Dashboard tracks unusual volume activity, helping you focus on stocks where market participation is rapidly increasing.
(link below)
#stockmarket
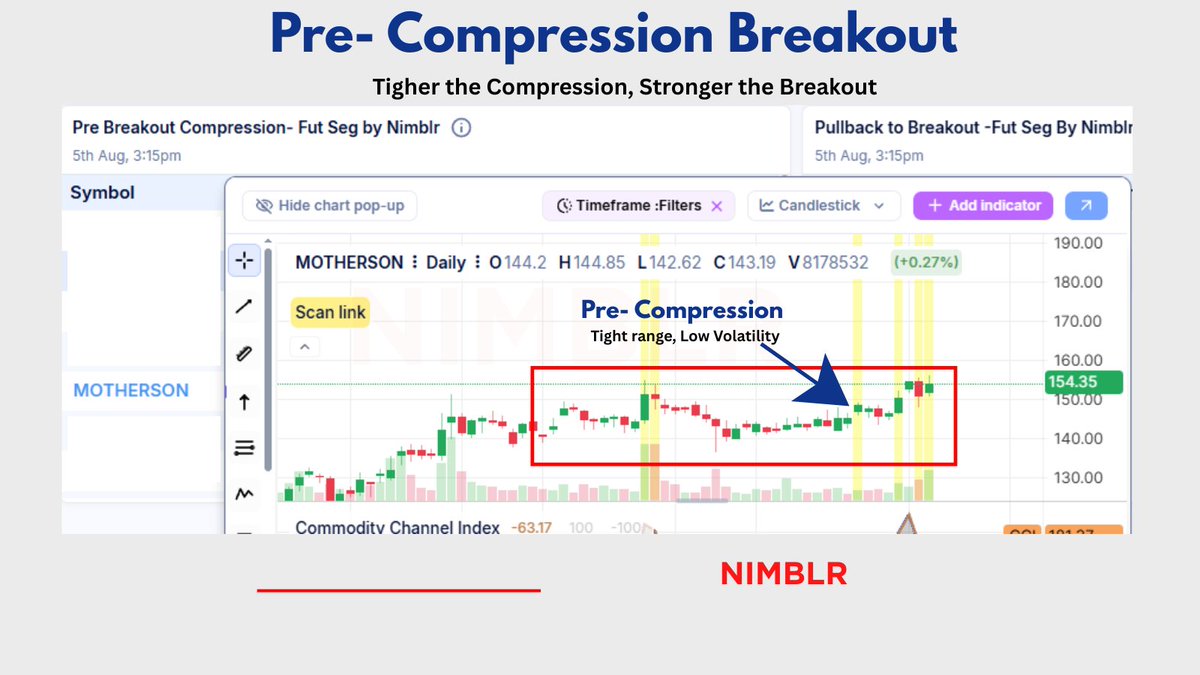
This highlighted zone is called Pre Compression.
1. Volatility contracts
2. Price trades in a tight range
3. Buyers & sellers reach temporary equilibrium
4. Waiting for ICMC Breakout
The longer price stays compressed without breaking down, the more energy it stores.
When that range finally breaks with volume.
that's often where the real move begins.
This is why I prefer finding stocks before everyone notices the breakout - not after.
My dashboard flags these Pre Compression setups so they're already on my watchlist before the move starts.
Not every setup breaks out.
But every strong breakout usually starts with a period of compression.
link below
#trading
#PNBHOUSING 1145
The chart is reaching an interesting zone.
Aug'17 - All-Time High at 1422.
Sep'24 - First attempt to clear 1182 failed.
Now price is back at the same resistance.
A strong weekly/monthly close above 1200 can open the path towards the All-Time High (1422).
And if that level gets taken out.
A new price discovery journey could begin.
Sometimes, the biggest moves start only after clearing years of resistance.
#MasterInOne
Guru purnima gift ❤️
Weekly breakout screener
You can scan weekly strong breakouts from this screener
Save screener, share to help others👍
https://t.co/1f4ahEGvcJ
Finding Active Stocks? Start With NSE
Most Traders Ignore
(NSE Secrets)
Bookmark this!
Want to know where the market activity is actually happening?
NSE → Market Data → Most Active Equities
This simple page can help you spot stocks attracting serious market participation.
How to use it:
🔹 Check Most Active by Volume
Where maximum trading activity is happening
🔹 Check Most Active by Value
Where significant money is changing hands
🔹 Look for stocks appearing near the top
These deserve attention for the day
🔹 Build a shortlist, not a trade
Use it to find WHERE to look, then use your setup to decide WHEN to trade.
The NSE website itself has several underrated tools hiding in plain sight.
Screen recording below shows the exact path.
Save this. You’ll use it again.
#NSE #StockMarketIndia #Trading
NSE Trick!
Pre Open Market = Your FREE Gap Up Radar
CASH + FNO both
One NSE page to check at 9:07 AM to find stocks worth watching for intraday.
Bookmark now!
PATH:
NSE Website → Market Data → Pre-Open Market
Then do this:
Sort by Change % / Change (Pts)
Look at the Top 5 gainers
Check again around 9:07–9:08 AM
Note stocks showing a meaningful gap-up
Add only the strongest names to your watchlist
What am I looking for?
→ Strong gap-up
→ Stock holding near the top of the pre-open list
→ Decent liquidity/volume
→ Preferably a stock already showing momentum
→ No random illiquid names
Direct NSE data.
Less noise.
A repeatable morning process.
#nse #stockmarketindia #trading
I am again sharing One of My most Popular Breakout Scanner , that I scan almost each day.
It helped me find out many stocks that I share with all of you.
https://t.co/cQwrpCEOTf
Yesterday post market had posted this.
Coming out of pre compression breakout scanner.
The purpose was solved, the users of this dashboard were ready.
NSE price gainers & volume gainers can only tell you a story on the day the buying is done.
The focus of precompression is built to be prepared for such moves.
Filters are good on the scanner.
acces link below
Let NSE build your FnO watchlist before 9:15 AM.
I prefer starting here:
NSE → Market Data → Derivatives Market
→ Pre-Open Market → Equity Derivatives
Bookmark this and try it tomorrow morning.
Around 9:07 AM:
�� Sort by Change % / Change (Pts)
→ Focus on the top 3 - 5 FnO stocks
→ Note where the strongest pre-open activity is
Now here’s the important part:
Gap up ≠ Buy.
Preopen data tells you WHERE to look.
Price action tells you WHEN to trade.
#nse #optionstrading #stockmarketindia
NSE Website Trick: Find Stocks Traded
- where the market is actively trading.
First bookmark this.
Most traders only look at price.
I also look at % Change + less on volume
Why?
✔️ High % change + strong volume = genuine market participation.
✔️ Big moves on low volume deserve extra caution.
This NSE report helps you quickly identify stocks attracting attention over the last few trading sessions for further study.
📌 I usually check it after market hours as part of my watchlist preparation.
⚠️ The report is official NSE data, but it may be updated with a slight delay. Use it as a study tool, not for live trading decisions.
#investing #trading #india
NSE Website Trick: Find where momentum is building
Bookmark this!
Want to know where price movement is being supported by changes in Open Interest?
You can check it directly on the NSE website.
NSE → Market Data → Change in Open Interest
Now observe these 2 combinations:
1️⃣ Price ↑ + OI ↓ = Short Covering
Existing short positions may be getting closed while the price moves higher.
This can sometimes lead to sharp upward momentum as shorts exit.
2️⃣ Price ↑ + OI ↑ = Long Build-Up
Price is rising AND new positions are being added.
This can indicate fresh participation alongside price strength.
When to check?
I prefer checking this after market hours for study.
⚠️ You’ll find many Index Options in the list.
If you’re studying individual stocks, filter/focus on stock derivatives.
You’ll find this data on many platform
But why not learn to check it directly from the NSE itself?
This is a market data observation tool, not a Buy/Sell recommendation.
#optionstrading #trading
Bruce Lee once said…
“You will continue to suffer if you have an emotional reaction to everything said to you.”
Similar in trading.
You will continue to suffer if you have an emotional reaction to every trade.
One SL → frustration.
One missed trade → regret.
One profit → overconfidence.
That is not trading.
That is emotional gambling.
#trading
Finding volume gainers is easy.
Finding which one is actually crossing resistance is the real work.
You can go to NSE and find:
• Volume gainers
• 52 week highs
• Most active stocks
But then comes the hard part.
Open each chart → Find the resistance → Check if it's actually crossing → Repeat.
That's the problem my Resistance Crossing Scanner solves.
It filters for stocks crossing resistance on the Daily TF every trading day.
Best time to check is Open & 15:15.
So instead of spending time searching for the setup, I can spend that time studying the setup.
Link below