Most indicators fail on news days because lagging math can't see live volume.
After 8 years of trading, I built the Institutional Core System (ICS).
ICS tracks raw CME data:
🔹 Real Limit Absorption
🔹 Liquidity Sweep Traps
Launching on Whop soon.
1️⃣ Follow @bastian_ics
Quick update
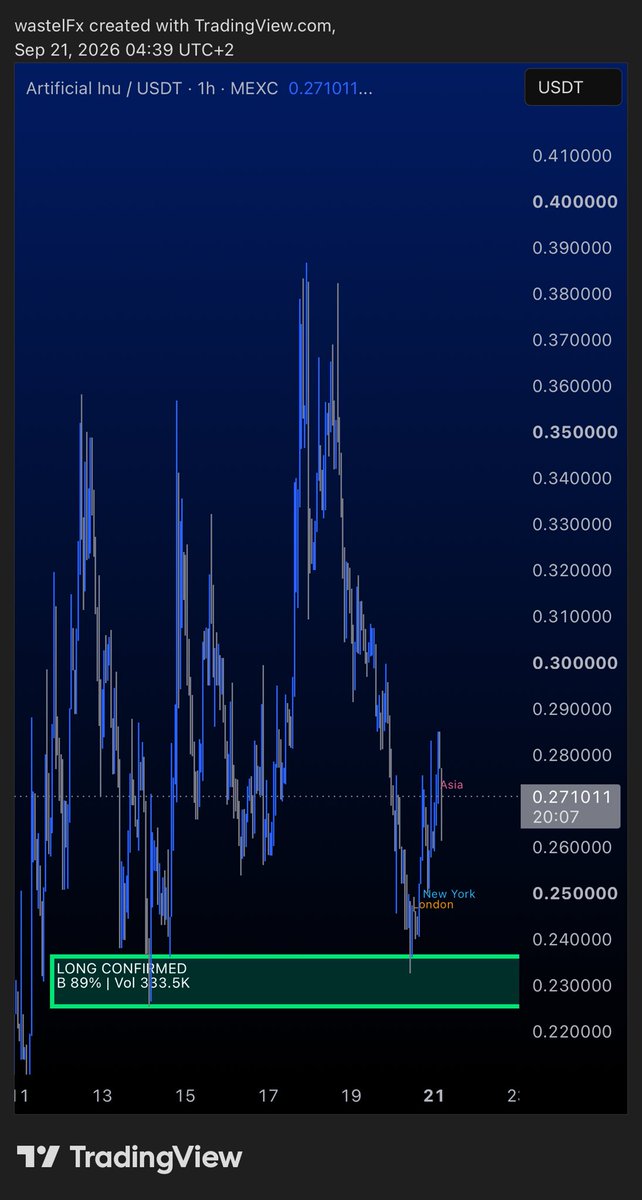
Rejection confirmed at the Buy Wall on robinhood:0x2e8c31162b855a2ffa90f6f8634643ad6f111e18 (1h)
The $0.223 - $0.236 demand zone (89% Buy Delta) held up as expected. Instead of getting absorbed, price bounced cleanly off the limit orders.
Watching closely to see if volume delta follows through from here.
@ArtificiallyInu
Institutional Core System (ICS)
https://t.co/IrgxWbSXlf
Order flow data like CME limit walls and volume delta is usually messy and overwhelming.
We’re launching soon to fix that: bringing high-precision institutional data directly to your TradingView charts in a clean, dead-simple visual format.
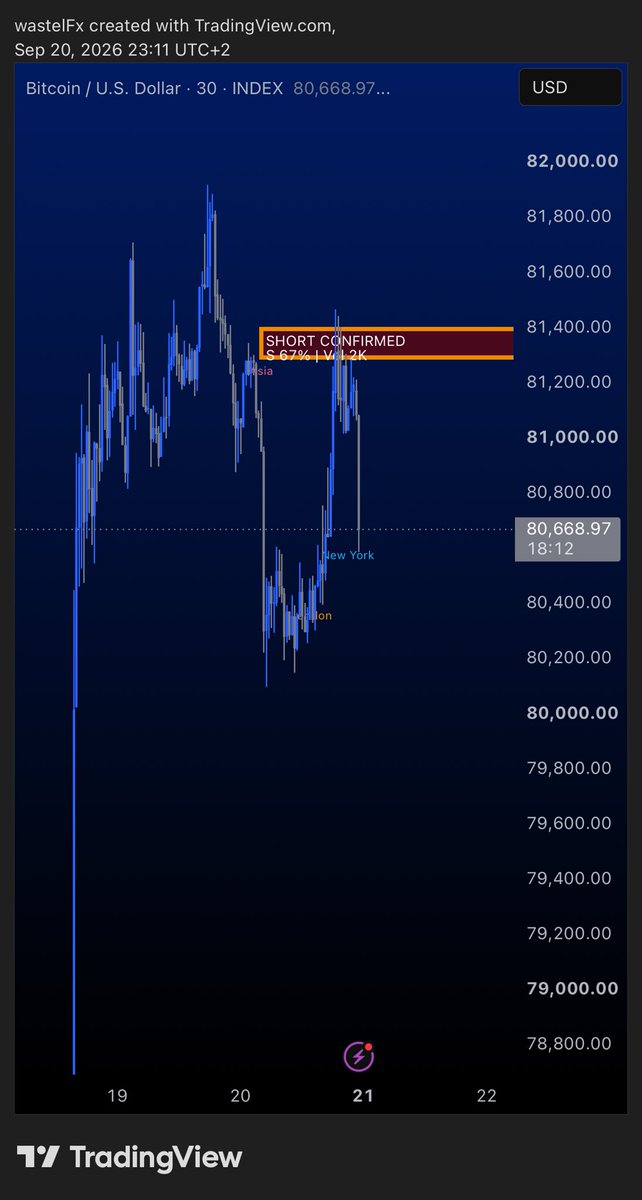
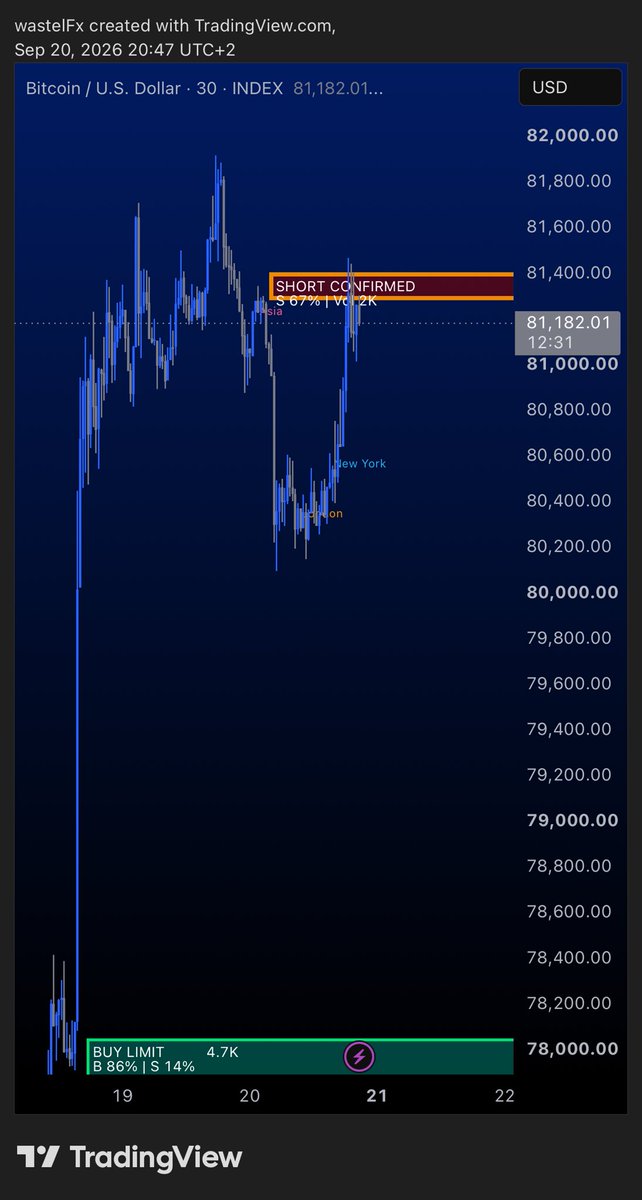
BTC Update: $81.1k — LTF Resistance vs. HTF Absorption
BTC hits a pause at $81.3k - $81.4k, where ICS identified a new M30 Short Wall (S 67% Delta).
The Key Takeaway:
Low-timeframe walls can pause momentum, but on lower timeframes, limit walls are often rapidly eaten through when high-timeframe buy pressure remains.
We are still trading inside the Weekly Wall Zone, actively consuming institutional sell liquidity before the next expansion. Watch how delta evolves.
XAU/USD (M30): Patience at the Key Order Flow Levels ⚠️
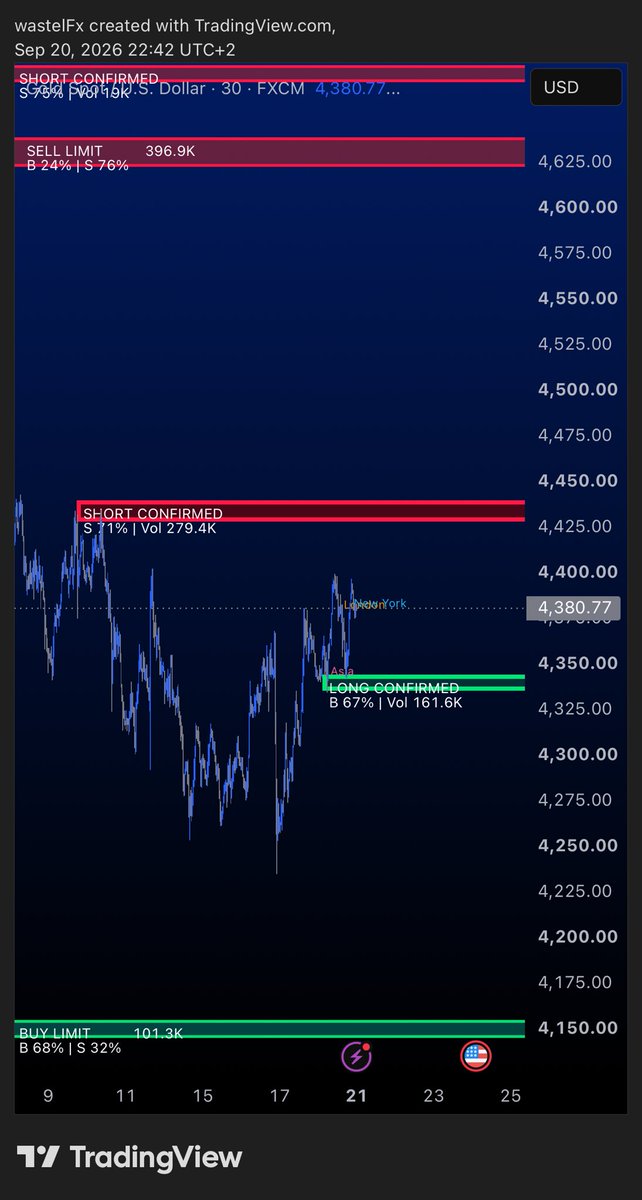
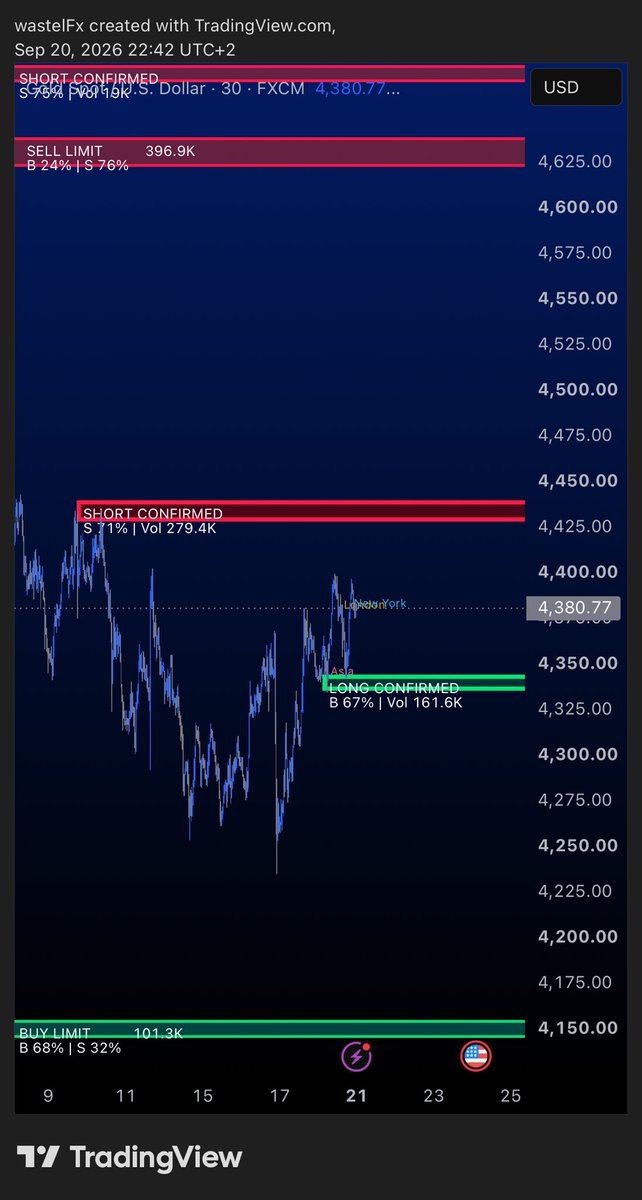
Current price is floating around $4,380.77, right in the middle of nowhere.
The M30 timeframe has defined two key zones for initial movement:
Upper Supply: $4,430 - $4,439 (SHORT CONFIRMED |
71% Sell Delta | 279K Vol)
Lower Demand: $4,336 - $4,342 (LONG CONFIRMED |
67% Buy Delta | 161.6K Vol)
My Approach: No trades in the middle. I'm patiently waiting for price to hit these M30 walls to observe how volume delta reacts.. whether we see an aggressive absorption or a sharp rejection.
Let the market come to the levels first. 🍀
XAU/USD (M30): Patience at the Key Order Flow Levels
Current price is floating around $4,380.77, right in the middle of nowhere.
The M30 timeframe has defined two key zones for initial movement:
Upper Supply: $4,430 - $4,439 (SHORT CONFIRMED |
71% Sell Delta | 279K Vol)
Lower Demand: $4,336 - $4,342 (LONG CONFIRMED |
67% Buy Delta | 161.6K Vol)
My Approach: No trades in the middle. I'm patiently waiting for price to hit these M30 walls to observe how volume delta reacts.. whether we see an aggressive absorption or a sharp rejection.
Let the market come to the levels first. 🍀
XAU/USD (M30): Patience at the Key Order Flow Levels
Current price is floating around $4,380.77, right in the middle of nowhere.
The M30 timeframe has defined two key zones for initial movement:
Upper Supply: $4,430 - $4,439 (SHORT CONFIRMED |
71% Sell Delta | 279K Vol)
Lower Demand: $4,336 - $4,342 (LONG CONFIRMED |
67% Buy Delta | 161.6K Vol)
My Approach: No trades in the middle. I'm patiently waiting for price to hit these M30 walls to observe how volume delta reacts.. whether we see an aggressive absorption or a sharp rejection.
Let the market come to the levels first. 🤗
XAU/USD (M30): Patience at the Key Order Flow Levels
Current price is floating around $4,380.77, right in the middle of nowhere.
The M30 timeframe has defined two key zones for initial movement:
Upper Supply: $4,430 - $4,439 (SHORT CONFIRMED |
71% Sell Delta | 279K Vol)
Lower Demand: $4,336 - $4,342 (LONG CONFIRMED |
67% Buy Delta | 161.6K Vol)
My Approach: No trades in the middle. I'm patiently waiting for price to hit these M30 walls to observe how volume delta reacts.. whether we see an aggressive absorption or a sharp rejection.
Let the market come to the levels first. 🍀
XAU/USD (M30): Patience at the Key Order Flow Levels
Current price is floating around $4,380.77, right in the middle of nowhere.
The M30 timeframe has defined two key zones for initial movement:
Upper Supply: $4,430 - $4,439 (SHORT CONFIRMED |
71% Sell Delta | 279K Vol)
Lower Demand: $4,336 - $4,342 (LONG CONFIRMED |
67% Buy Delta | 161.6K Vol)
My Approach: No trades in the middle. I'm patiently waiting for price to hit these M30 walls to observe how volume delta reacts.. whether we see an aggressive absorption or a sharp rejection.
Let the market come to the levels first. 🍀
XAU/USD M30: Locked Between Two Institutional Walls
Gold ($4,380) is currently trapped in a clean $100 range defined by raw order flow data:
Demand Zone: $4,336 - $4,342 ( LONG CONFIRMED |
67% Buy Delta) held firm during the Asian sweep.
Supply Zone: $4,430 - $4,439 (SHORT CONFIRMED |
71% Sell Delta | 279K Vol) forms the major overhead ceiling.
The Gameplan:
Mid-range execution is pure noise. Watch if London/NY sweeps the liquidity towards either limit wall to see if volume delta triggers a full absorption or a heavy rejection.
Trade the liquidity, not the middle.
Scammers found a way to make people drain their own wallets without sending them a phishing link.
They uploaded YouTube tutorials showing people how to build an AI crypto trading bot with Claude.
People followed the tutorial themselves.
Copied the code.
Deployed the smart contract themselves.
Funded it from their own wallets.
And approved every transaction themselves.
Except the “trading bot” had no trading logic.
It was built to send their ETH straight to the scammers.
224 wallets lost 274.6 ETH, worth about $517,000 when it was stolen.
The median victim lost 1 ETH.
Some victims even got an error after getting drained telling them to deposit another 50% to fix the bot.
They literally got people to build, fund and approve their own wallet drainer.
You've got to be very careful this days
Why you should NEVER trade the Monday Asia Session. ⚠️
Monday morning is the most dangerous time for retail traders. Here is what's actually happening behind the charts:
1. Thin Liquidity = Institutional Playground
Over the weekend, macro news builds up, but volume during Asia is extremely thin. Large desks use this low liquidity to test levels, trigger retail stop-losses, and build positions without slippage.
2. The Monday "Trap Box"
Price often prints fake breakouts above or below Friday's
high/low. Retail sees momentum and buys in-only for London to completely reverse the move and sweep both sides.
3. Spreads & Manipulation
Weekend gaps paired with low volume mean wider
spreads and erratic price action. You're paying more to enter a high-risk move.
The Strategy:
Treat the Monday Asia session as a blueprint, not a setup.
Let the market build the Asian Range. Mark the high and low limit walls, and wait for London or New York to sweep that liquidity with real volume.
Don't be the liquidity for someone else's order.
Want more helpful tips? Like RT and follow 🍀
Not time to quit-time to shift focus. After 5 years, strategy and market knowledge usually aren't the problem anymore.
The issue at that stage is almost pure risk management and psychology. Stop tweaking the edge and start auditing your behavior. Fix the discipline, not the charts.
My tool on your charts."
That's the entire vision.
ICS isn't about selling signals.
It's about giving retail traders the institutional data lens they need to execute with clarity.
Real liquidity. Real volume delta. Transparent analytics. Easy to Read for everyone 🍀
Pre-register now 🔥