🔴 Every time oil prices have surged 50% above trend, it has been followed by an economic recession.
This indicator has correctly predicted 6 out of 6 recessions — a 100% hit rate.
Now, that threshold has been triggered again…
🛢️ #Oil
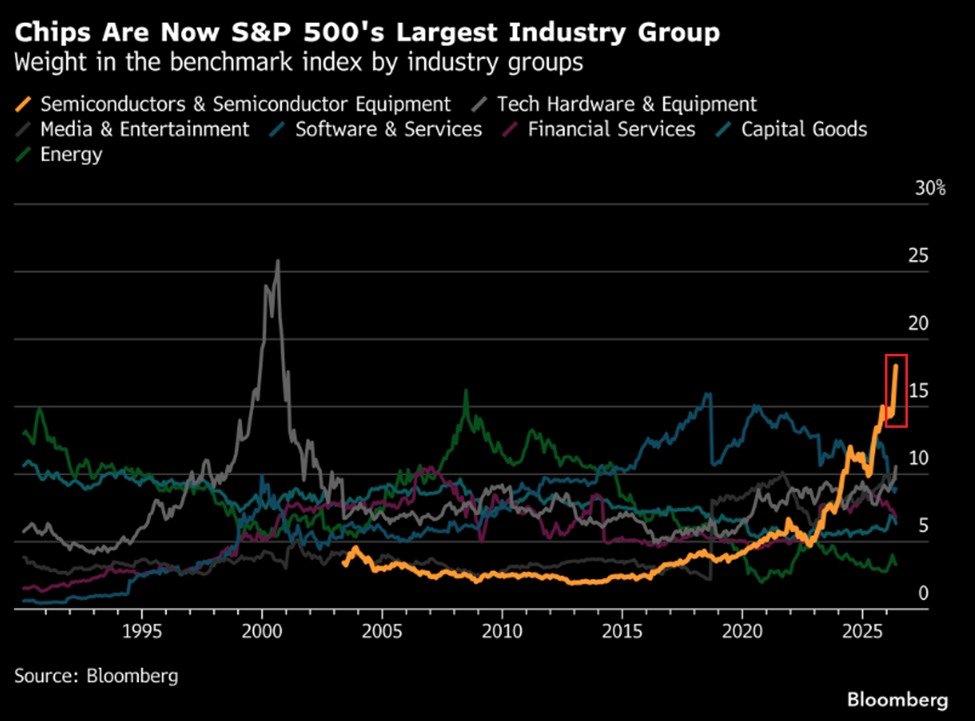
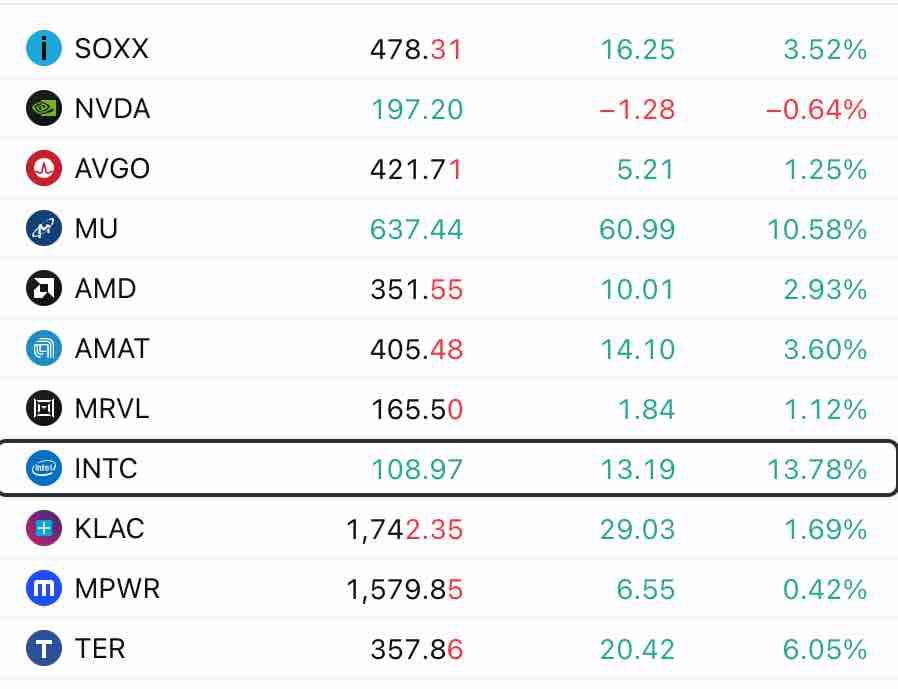
BREAKING: Semiconductor and semiconductor equipment stocks now account for a record ~18% of the S&P 500's total market cap, the biggest weighting for any single industry group.
This percentage has more than TRIPLED since the 2022 bear market.
By comparison, at the peak of the 2000 Dot-Com Bubble, Tech Hardware and Equipment peaked at ~26%.
Furthermore, the Semiconductor Index, $SOX, relative to the Magnificent 7 is up to 85 points, the highest since mid-2020.
This comes as $SOX has rallied +159% since the start of 2025, materially outperforming the Magnificent 7's gain of +30%.
This run in semiconductors is unlike anything in market history.
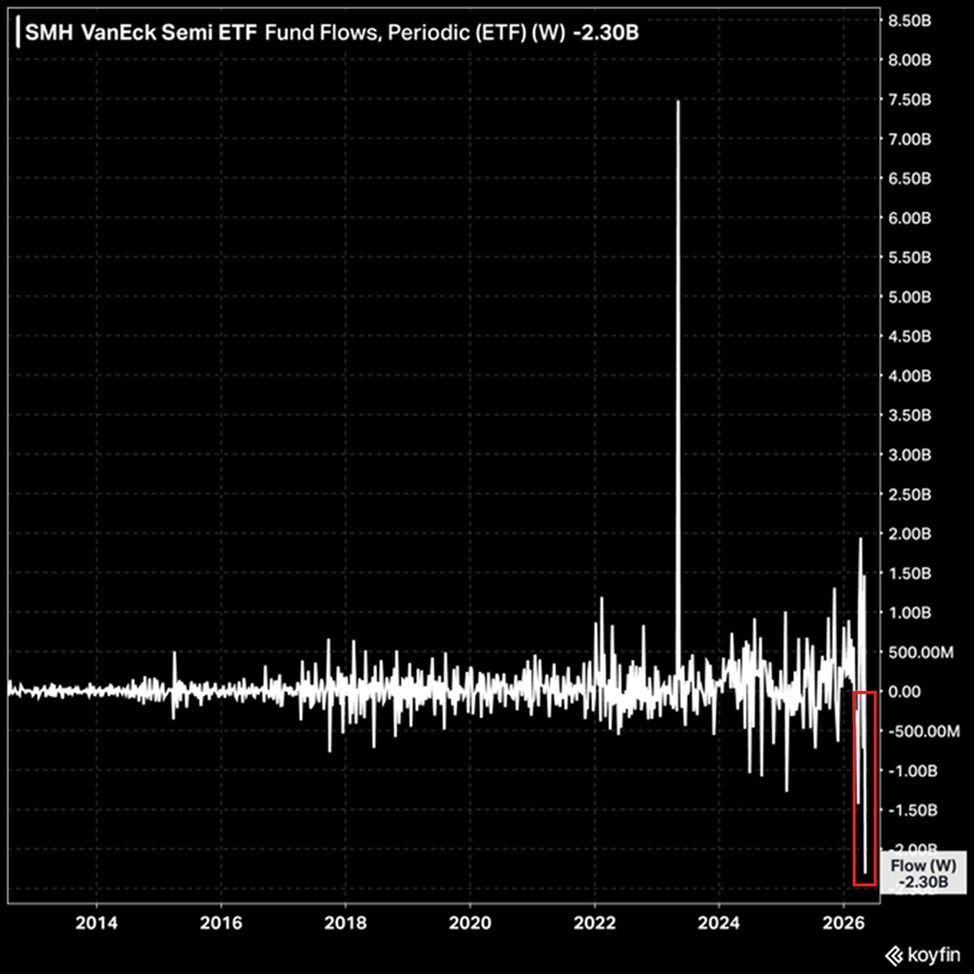
BREAKING: The semiconductor ETF, $SMH, posted -$2.3 billion in outflows in the week ending May 7th, the largest weekly outflow since the fund launched in 2011.
This follows +$1.5 billion in inflows in the preceding week, the 3rd-largest on record.
Previously, in April, semiconductor ETFs, $SMH and $SOXX, attracted +$4.7 billion in combined inflows, the largest monthly intake on record.
Meanwhile, the 3x leveraged long Semiconductor ETF, $SOXL, posted -$842 million in outflows in the week ending May 7th, its 5th consecutive weekly withdrawal.
Over this period, investors have withdrawn -$8.9 billion in total.
Retail investors are cashing-in massive profits on semiconductor stocks.
Retail demand for tech stocks is exploding:
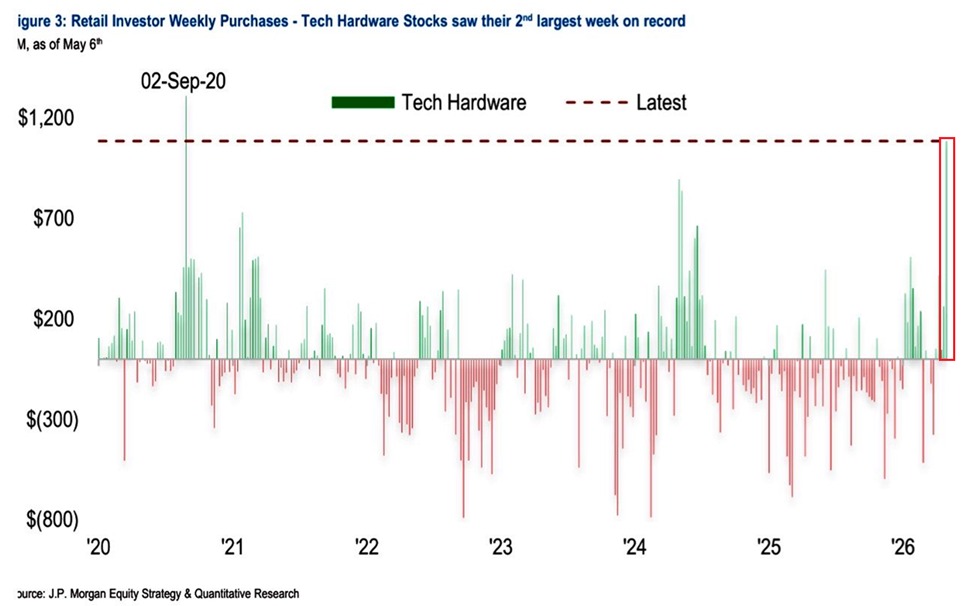
Individual investors bought +$1.1 billion of tech hardware stocks in the week ending May 6th, the 2nd-largest weekly purchase on record.
This group includes Apple, $AAPL, SanDisk, $SNDK, Dell, $DELL, Super Micro Computer, $SMCI, and others.
This marks the 5th consecutive weekly purchase.
The only other week in history with a higher number of purchases was in September 2020, at +$1.3 billion.
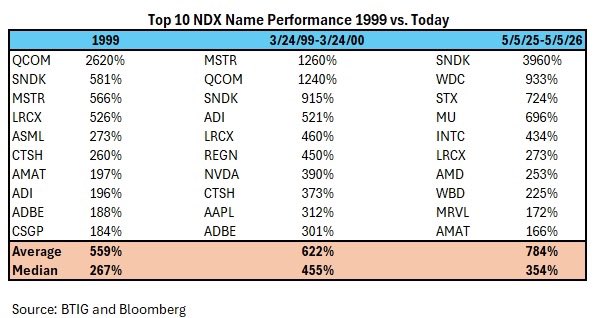
Meanwhile, SanDisk is up +3,731% over the last year, the best-performing stock of the Nasdaq 100 index.
This exceeds Qualcomm's gain of +2,620% in 1999, the strongest annual return of the entire Dot-Com Bubble era.
Euphoric sentiment has arrived.
Great commentary yet again from BTIG’s Jonathan Krinsky
•Party Like It's 1999. In 1999, the best performing Nasdaq 100 stock was Qualcomm (QCOM, not rated), up 2600%. The best rolling 52-wk return for QCOM during the entire dot-com bubble was 2600%, so SNDK is beating that by 1300bps. Interestingly, the second-best stock in 1999 was SNDK up 581%.
•More Extreme. If we look at the top 10 performing NDX stocks in 1999, they were up an average of 559%. The top 10 in the year leading up to 3/24/00 were up an average of 622%. The top 10 NDX names over the last year are up an average of 784%, beating both the dot-com periods..
The market is missing the math on $SOL. 🔍
Over the last 12 months, Solana's revenue exploded to ~$2.85B (up nearly 100% YoY), while the token price "reset" -43%.
Comparing the giants:
💿 NVIDIA ($NVDA)
• P/S Ratio: ~22.4x
• Growth: %65 The AI gold standard, but priced for perfection.
⚡️ Solana ($SOL)
• P/S Ratio: ~17.2x
• Growth: ~100% Revenue growth.
• Efficiency: 8x more "revenue efficient" than Ethereum.
At a lower sales multiple than NVDA and triple-digit revenue growth, $SOL is looking more like a high-growth tech disruptor than a speculative coin.
#Solana #NVIDIA #Crypto #DeFi
🔴 Every time oil prices have surged 50% above trend, it has been followed by an economic recession.
This indicator has correctly predicted 6 out of 6 recessions — a 100% hit rate.
Now, that threshold has been triggered again…
🛢️ #Oil