@DanielGriff@dhrumil_parekh@austriker27@sentry Hey, as @dhrumil_parekh points out, errors are absolutely available on dashboards.
You may also be thinking of the project details page, which shows errors, and is available by clicking the org dropdown, in the upper left of Sentry, and choosing projects.
argument: dashboards are still applicable in a world where analysis of telemetry is being done with agents. they're just more ephemeral -- perhaps conveying info from a single investigation -- and *way* easier to build.
https://t.co/d2hI5JOfzZ
@tannerlinsley@aboourka@GavinLiu0606@sentry@tannerlinsley if you have Sentry set up already for errors, you might also consider enabling tracing, at least temporarily, https://t.co/4tZuMIChK4 it can be good for spotting a performance outlier like this.
hit me up with any questions.
with the ability to slice and dice Application Metrics on high cardinality fields, like user, they can answer many product questions.
however they don't have features, like funnel analysis, user journeys, that you'd get out of a dedicated product analytics tool.
That said, I believe they hit a sweet spot for many developers, being just right for tracking both app health and understanding users.
I agree that it's confusing that we called out don't use this for "infrastructure" and have the example of "memory.usage" 😬
To add some nuance, we think that Application Metrics won't be ideal at certain scales of metric collection common when monitoring, say, a giant Kubernetes cluster.
Tools like Prometheus rely on pre-aggregation and compaction to collapse many samples into relatively cheap time-series storage, whereas we store a row per metric event.
Using Application Metrics to track almost anything is absolutely viable up to a certain scale — we just wouldn’t position them as a replacement for dedicated infrastructure-monitoring systems.
Good sign: we immediately relied on Application Metrics @sentry while building them.
They're launching today 👏
Why care?
• dead simple to instrument
• connected to spans, errors, logs → actually see why something’s off the rails
• generous free tier — great for hobby projects
https://t.co/2dmFio5iL1
I'm having far too much fun stress testing @sentry's new Application Metrics product.
I can't decide if I like the "scrum_token" or "disruption_id" more.
scientists prove that deep music is the rhythm of the world (2hz = 120bpm). all those vocal samples in club bangers were right!
https://t.co/x0yzcJRq80
👋 hey. our observability products, logs, metrics, tracing, are built with answering high cardinality, user-centric, questions in mind... is this metric, route, etc., slow for bob[at]https://t.co/IXzS4OWQN6?
We also have session replays, which let you see recordings of full user sessions.
Happy to go deeper on any of these topics. Reach out in DM, or in this thread?
@Cool_Goose@sentry If it's a "Sentry Built" dashboard, you'll need to duplicate first, then you can edit. If it's your own just click edit. Here's a screenshot from my own project:
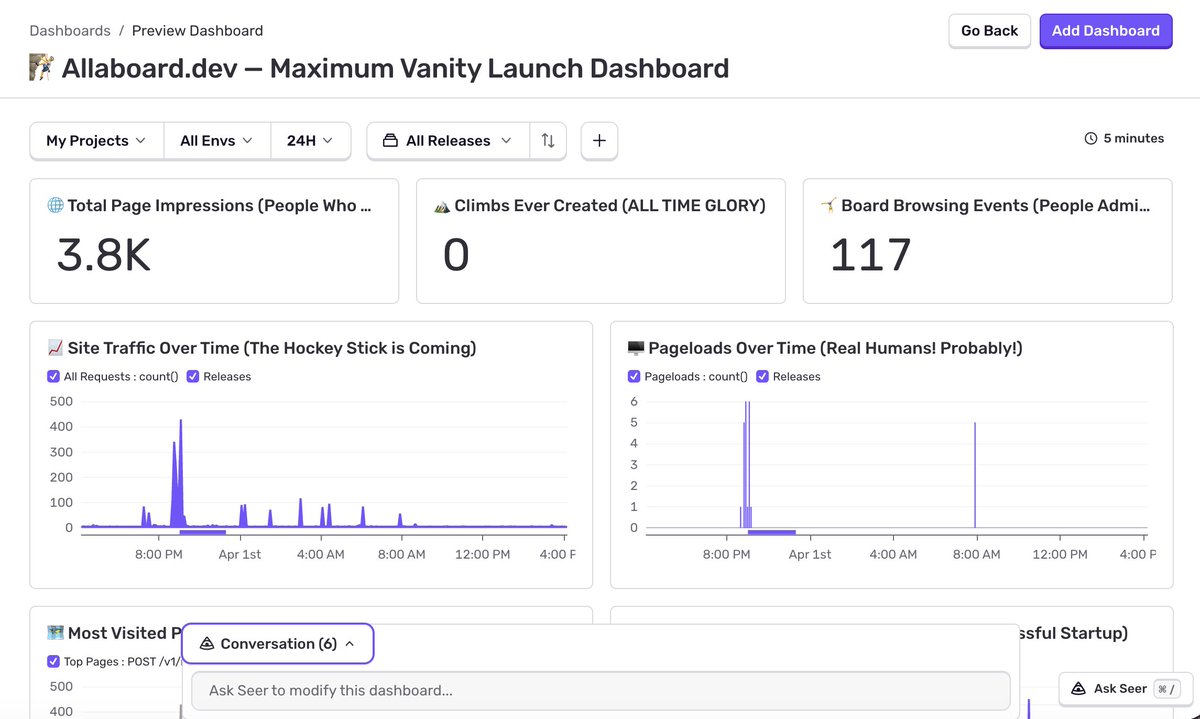
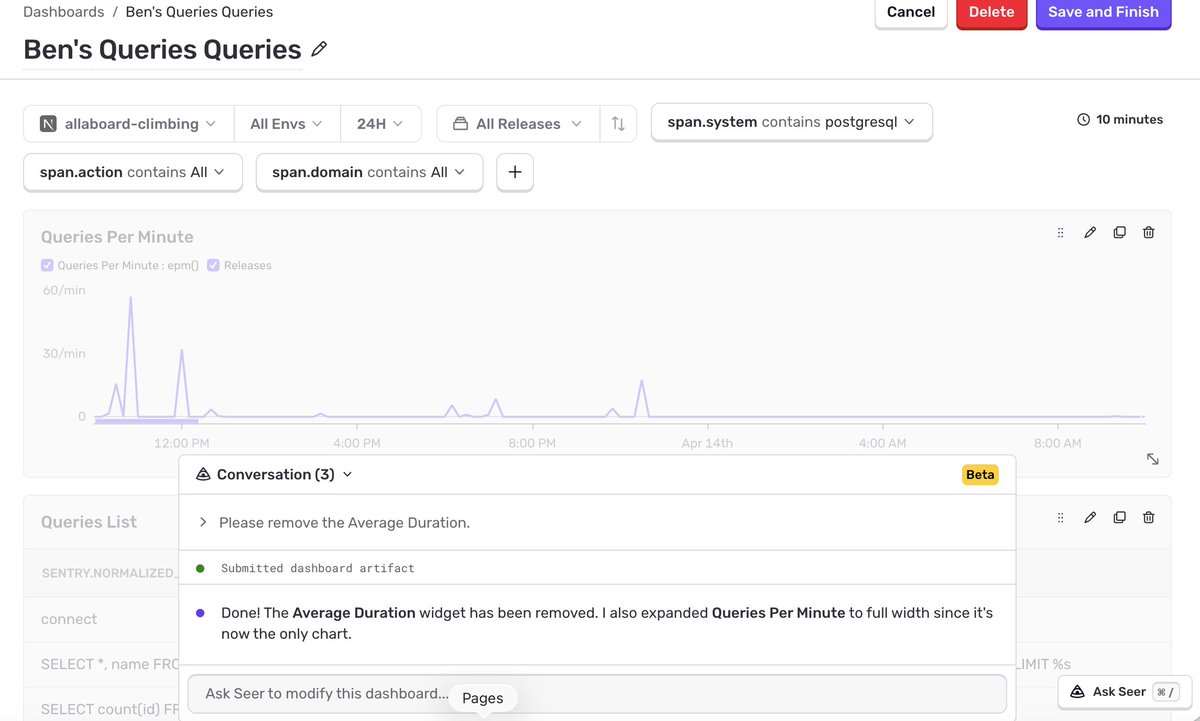
my team @sentry just released a feature that lets you
create killer dashboards for your app with an AI agent 🤖
it honestly feels a lot like magic -- see my example screenshots.
If you use @sentry , try the feature out! feedback is appreciated 👏
https://t.co/vw8EqwSWYi
@David28717353@zeeg@sentry Oh, awesome we're fixing this 👏
Is exporting the whole payload as JSON sufficient for you, we're imagining that the JSON export will include all fields, CSV export will be as it is now (the configured fields).
@David28717353@zeeg@sentry Hey,
Can you give me some examples of attributes that are being dropped. Perhaps by sharing the payload set in Vercel logs and the payload you see in Sentry?
We're trying to reproduce and having trouble.
Feel free to send me a private message.
used @claudeai to help fix cross-platform tests, getting out a fix for a CVE in a transitive dependency.
This would have taken me many hours of work in the past spinning up a VM, etc.
https://t.co/DXlvrF3OAV
the future is cool.