benim iradem : çok çalışmak
yaptığım hiçbir hatadan gocunmuyorum, gencim yaparım.
elbet bir gün, o hata denen illetin, aslında başarıya götüren bir yokuş olduğunu gülümseyerek hatırlayacağım.
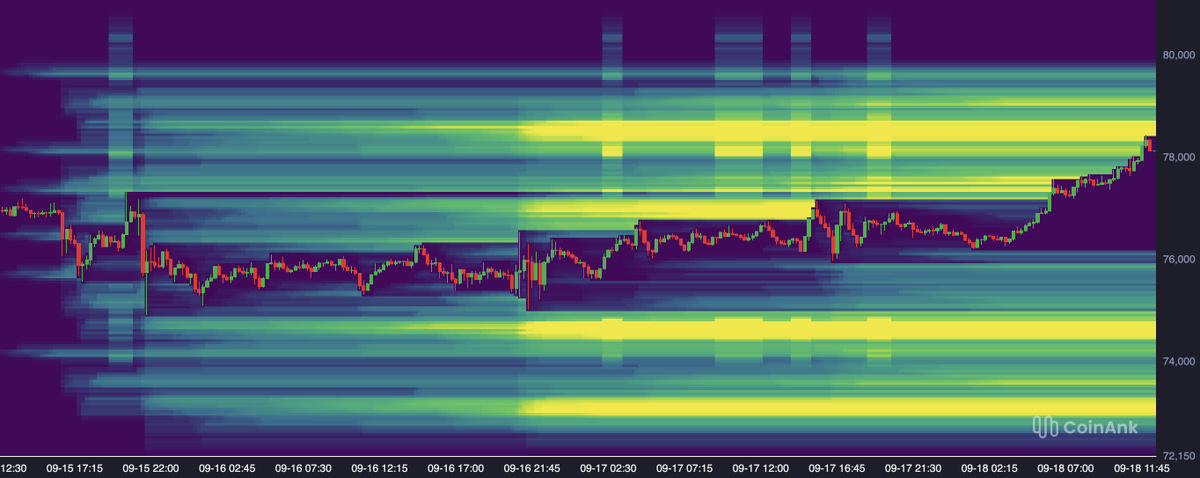
BTC is climbing, but liquidity is building up rapidly below.
Major clusters are forming around $74.5K–$75K and $73K.
The rally may continue, but the growing liquidity below raises the possibility of a downside sweep #Bitcoin
BTC vs ETH Positioning
On Binance perpetuals over the past 7 days, BTC longs sit at 50.74%, placing them in just the 14.6th percentile.
ETH longs are at 72.14%, in the 96.1st percentile.
Result: BTC positioning is relatively light, while ETH longs are heavily crowded, increasing the risk of a long squeeze. #Bitcoin #Ethereum
BTC shorts got squeezed hard.
Liquidity above 76K was cleared, pushing price as high as 76.8K. The sharp drop in Open Interest confirms a large short flush #Bitcoin
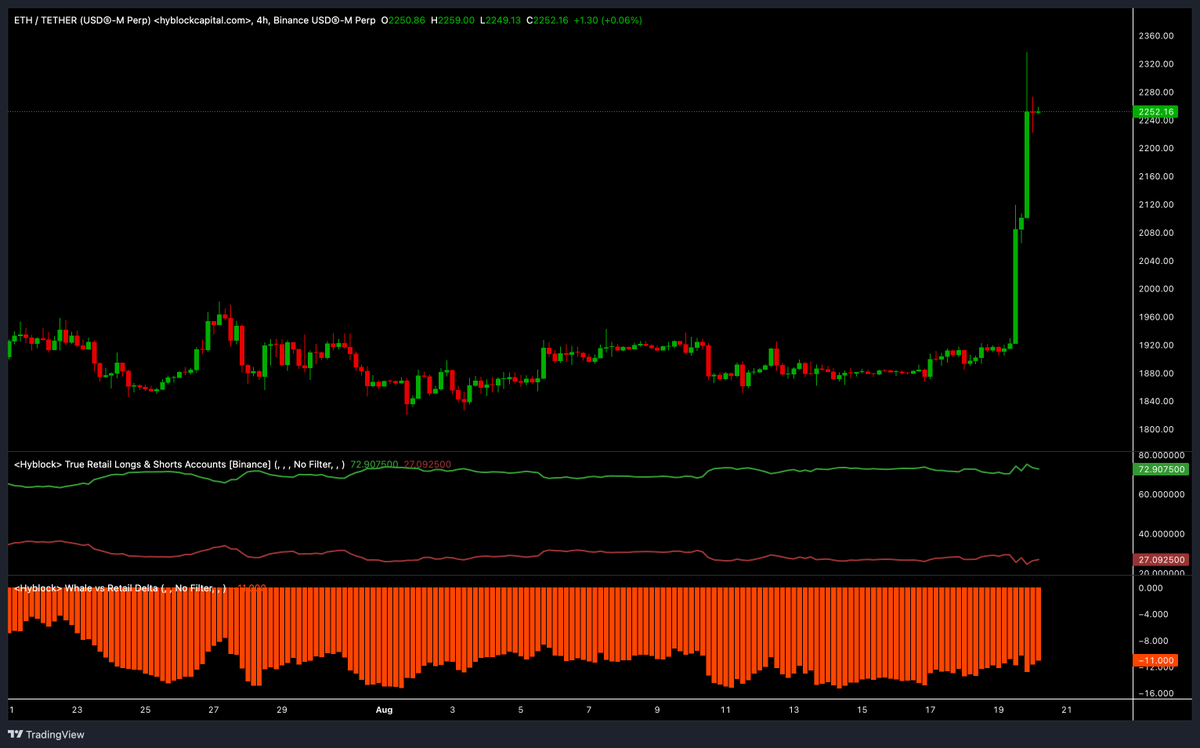
ETH ky long short positioning data:
• Retail Long: 72.91%
• Retail Short: 27.09%
• Whale vs Retail Delta: -11.00
Retail is heavily long, but whales remain positioned against that crowding. A -11.00 delta shows smart money is still leaning the other way #Ethereum
BTC : There is significantly more long liquidation liquidity accumulated below the current price.
Long liquidation levels: 1,037
Short liquidation levels: 136
Difference: +901
Short-term momentum remains strong, but from a liquidity perspective, the risk of a sharp downside sweep is higher. The $68K–$66K zone is the key area to watch #Bitcoin
Ethereum is consolidating at a critical level.
If #ETH closes an HTF candle below $1,900, I expect price to target the lower liquidity zones. The key levels are $1,865, followed by $1,830 and $1,800.
A decisive close is essential for confirmation.
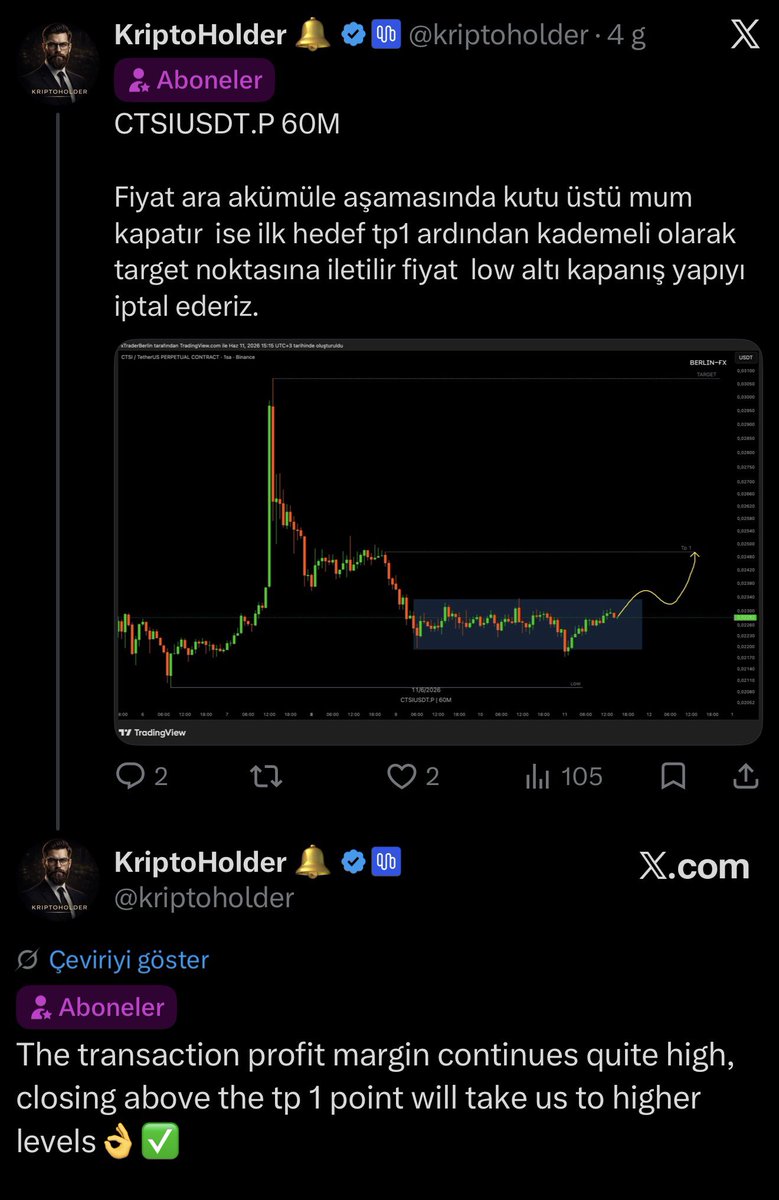
Subscriber-only content is not just “long/short” signals.
Each setup is built around CVD, liquidity zones, spot exchange flows, clear target levels, invalidation points and a step-by-step TP plan.
The first image shows the plan.
The second image shows the result.
For data-driven market tracking, the subscription section is active.#BTC #ETH
Bitcoin's ability to hold above the $63,000 region following US-Iran developments is significant.
High spot CVD inflows indicate that the movement is supported by real spot demand rather than leverage.
It creates a reliable foundation. #Bitcoin
#Bitcoin Stock markets, which started the day with selling pressure, saw some buying for the first time in a long time. This is not enough to signal a reversal; it only indicates that the price will get some breathing room as they buy in an area where selling pressure is so intense.
The key point for BTC is not just the drop, but the fact that liquidity is starting to rebuild above price.
While BTC is ranging around 66K, a large short-liquidity zone is forming between 68K–72K. This setup can indicate a market preparing to force panic selling first, then hunt upside liquidity.
However, delta is still negative, so there is no confirmed reversal yet. This area should be treated as a manipulation zone, not a clean bullish structure.
#BTC #Bitcoin
General Conclusion
BTC structure remains weak.Liquidity is building above, but spot and delta data still do not show strong buying. Retail is moving into longs, while whales are not giving clear support. That makes the 70K–72K range critical in the short term.Sustained price action below 70K could deepen selling pressure.
If 72K is reclaimed, the first reaction target becomes the 74K–76K range.#Bitcoin #BTC #Crypto
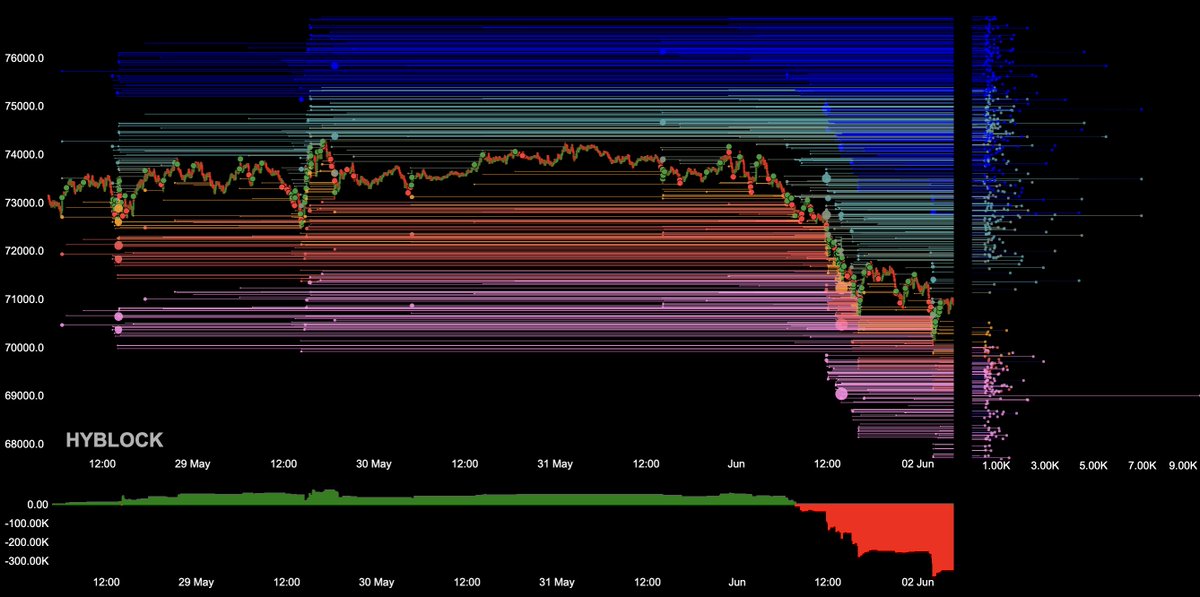
4/4 — Orderbook / Liquidity Walls
On the orderbook side, while BTC trades around 70K–71K, heavy sell walls are visible above.
The first resistance zone is 72K–73K. Without reclaiming this area, it is difficult to say that price has regained strength. Higher up, the 74K–76K range remains the main supply zone.
Below, liquidity clusters are visible around 69K–68K. If BTC holds below 70K, price may move toward this area for another liquidity sweep.
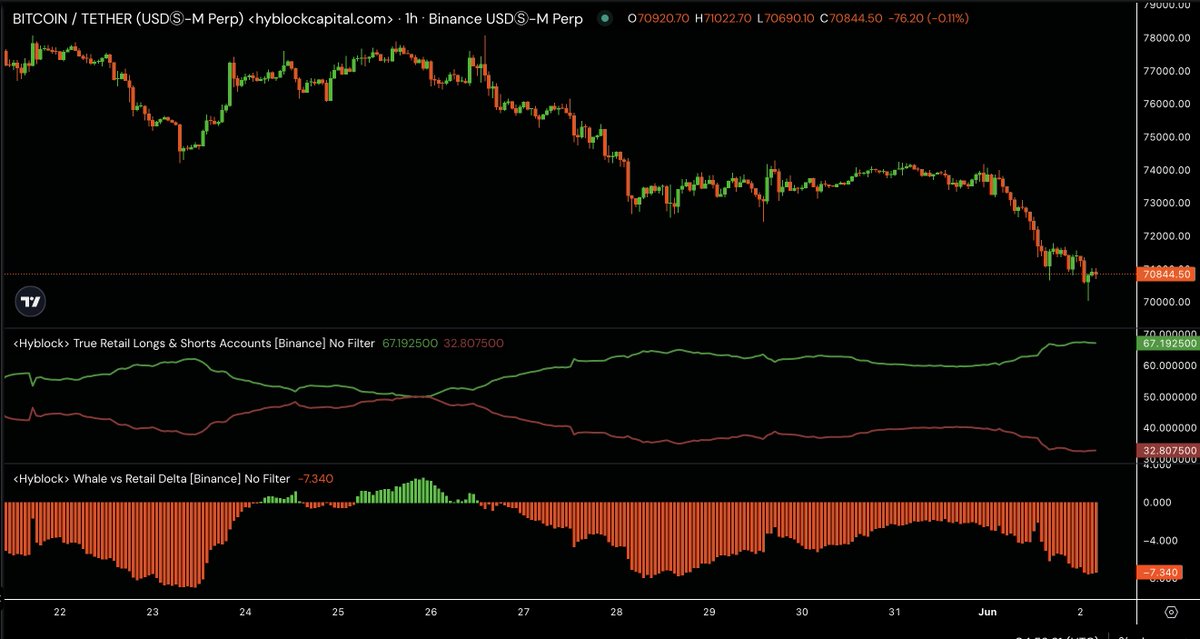
3/4 — Whale vs Retail Delta
The whale vs retail delta remains in negative territory. This shows that larger players are still not aggressively supporting the market from the buy side.
Retail appears to be treating the drop as a buying opportunity, while whale behavior remains more cautious. This divergence explains why price reactions remain weak.
In short, there is still no strong accumulation signal. Without a recovery in whale delta, upside moves may remain limited to short-term reactions.
2/4 — Retail Long / Short Balance
Retail long exposure is increasing while short exposure is declining. This usually shows that small traders are trying to call a bottom during the decline.
However, there is still no clear reversal signal on price. If retail longs keep rising while price continues to fall, the market may keep pressuring these positions.
For a healthier recovery, rising long exposure alone is not enough. BTC needs to regain acceptance above 71.5K–72K.
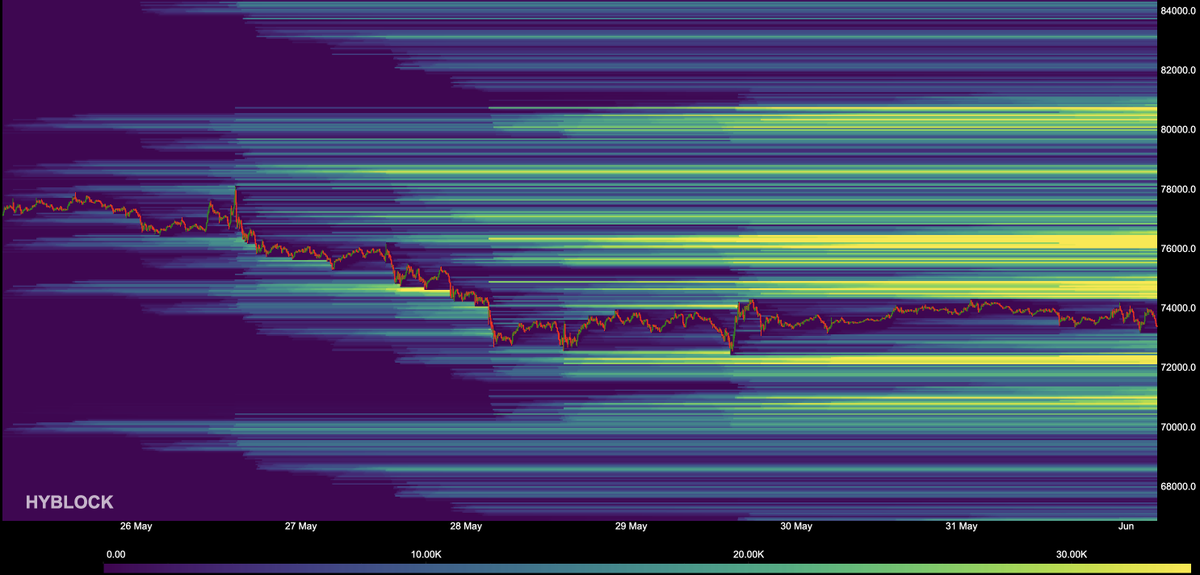
BTC liquidity map shows price compressing around the 73K–74K range while liquidity is clearly building above.
First major zone: 76K–78K.
Main liquidity pool: around 80K.
Below, 72K remains short-term support.#Bitcoin#BTC
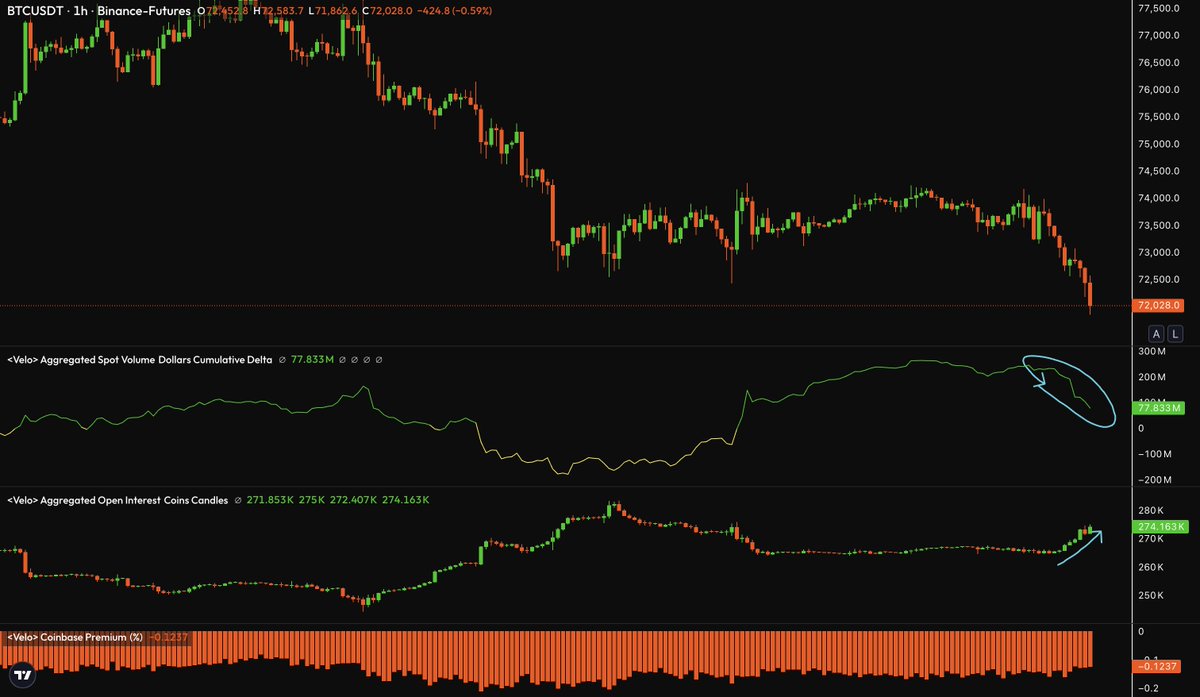
Weakness in BTC is becoming clear.
Spot CVD is turning sharply lower, Coinbase Premium remains negative, and Open Interest is rising at the same time. This structure shows that the decline is supported by spot selling while new positions are entering the market.
72K is the critical threshold. Below it, selling pressure could accelerate. #BTC
#BİTCOİN In Bitcoin, 15-20% of the positions opened from the futures are still closed, there is an 80% position that needs to be closed, we may see harsh movements for this leverage cleaning in the coming days. #BTC
#ETH While the Eth futures position increase continues, the spot outputs are quite aggressive, if you want a bitcoin update, write in the comments, let's see bitcoin too