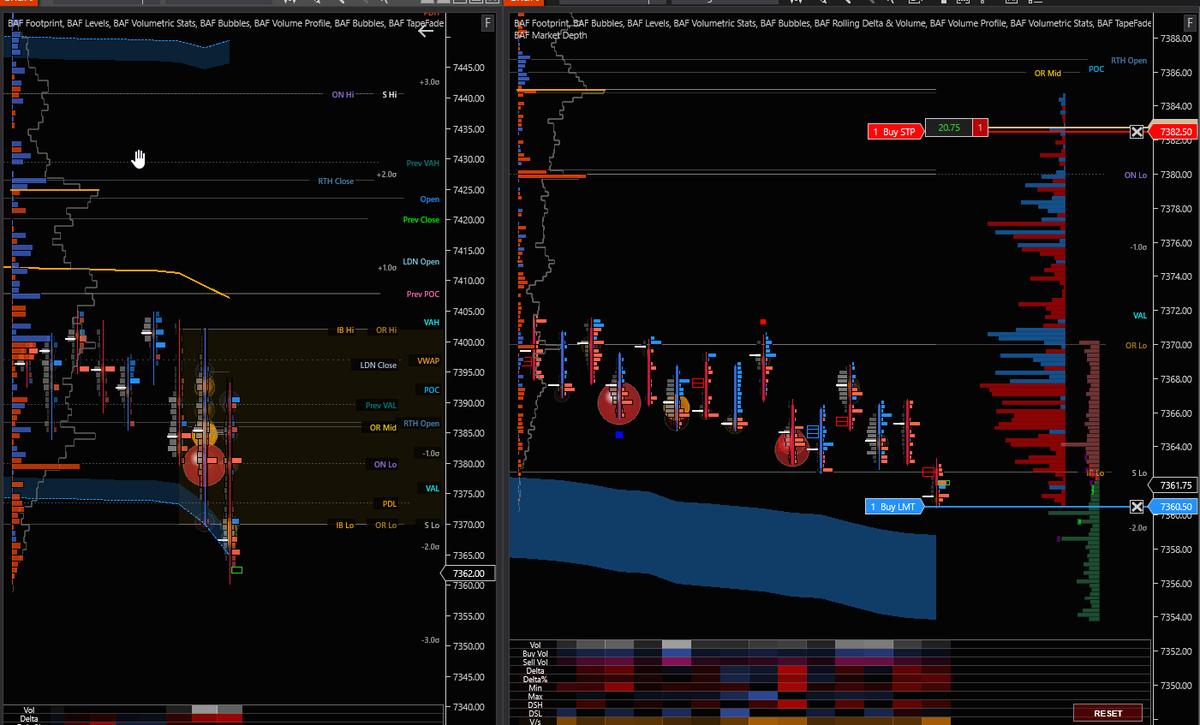
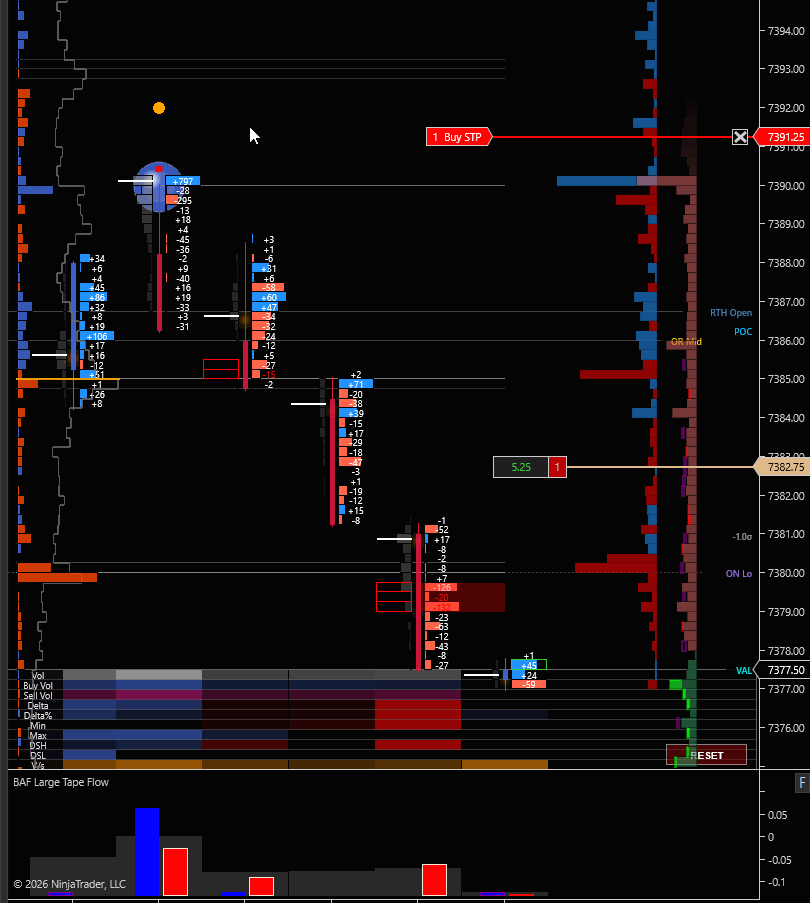
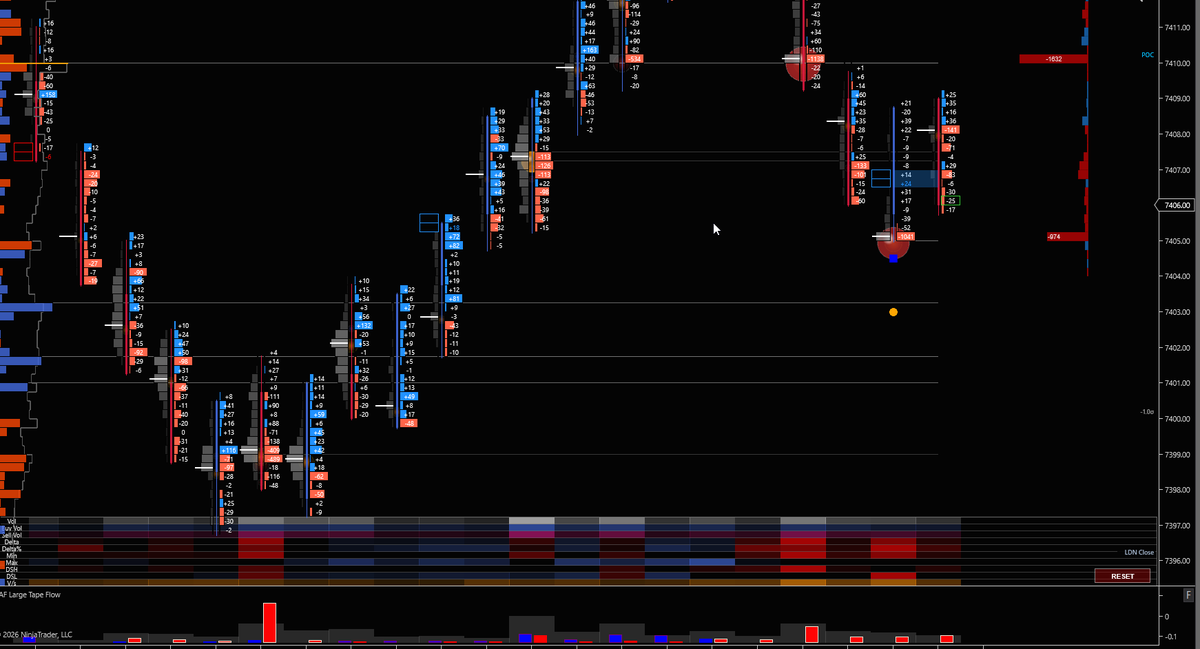
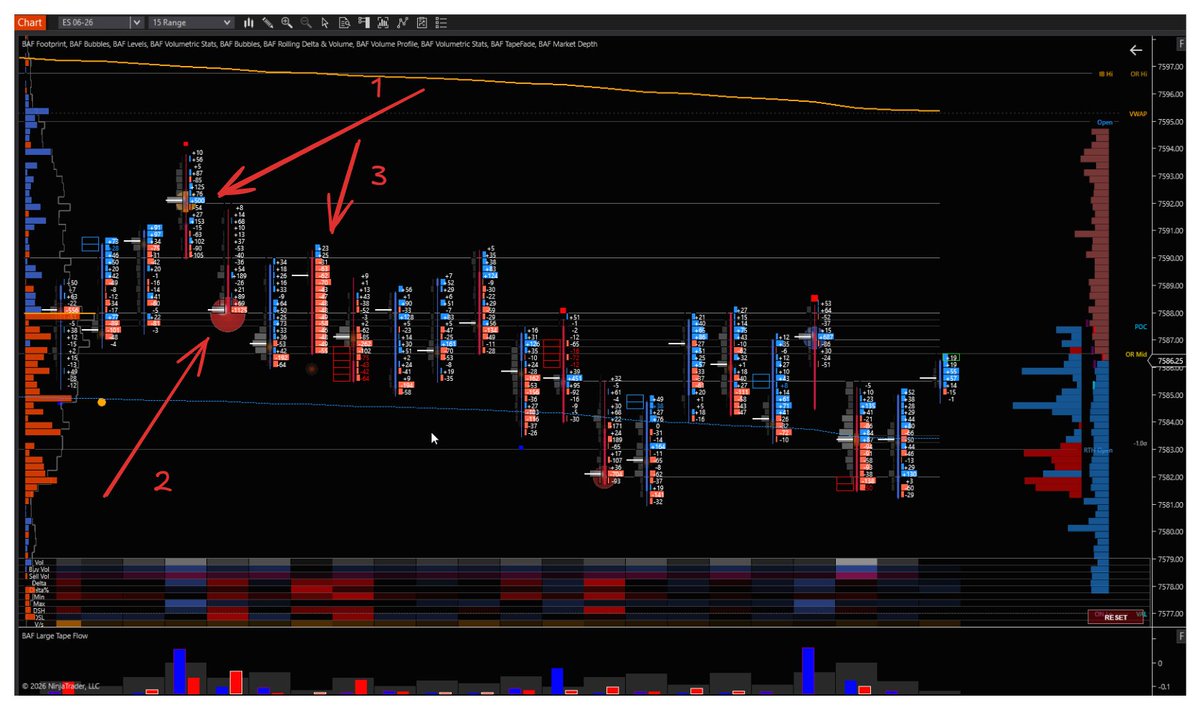
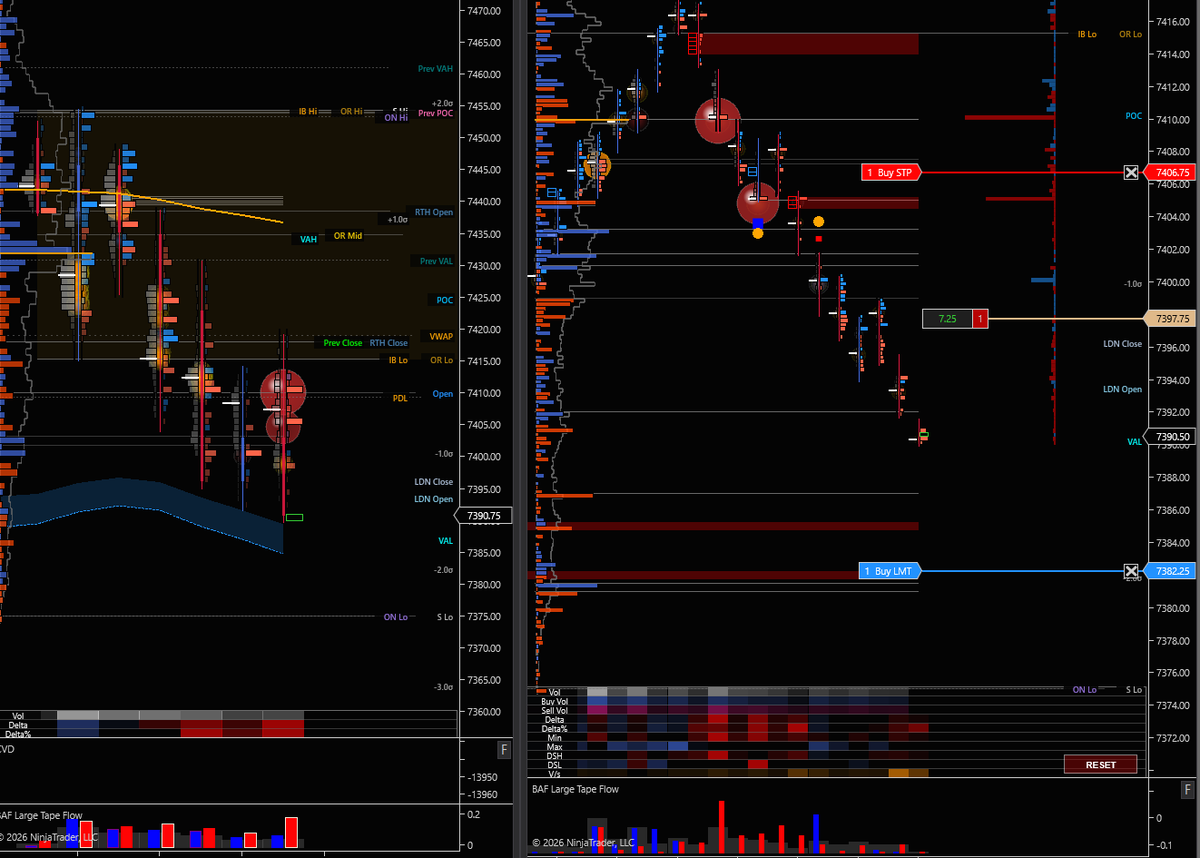
@TanishJain89812 2/2 Of course, I also have a Footprint chart showing volume per cluster, sized relative to the visible range, and delta per cluster for each bar. I keep an eye on Cumulative delta and large prints hitting the tape as well.
@TanishJain89812 Hi! It is MTF ES workspace. I use volume profiles with delta, along with a rolling delta profile. I’ve also set up relative size Delta Bubbles for the visible range, as well as Volume Bubbles. Additionally, I have Bar Statistics displayed with a heatmap color scheme. 1/2