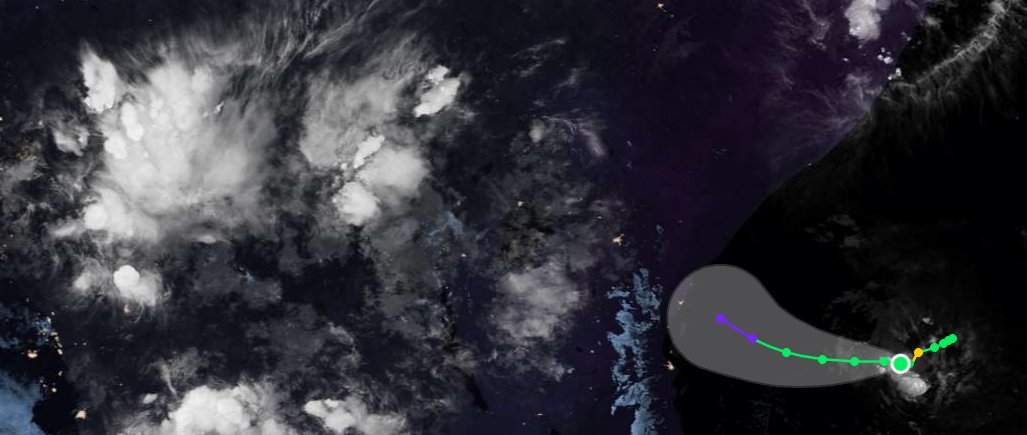
YES it’s me your local enby meteorology fur!!
(I’m quite a bit traumatized, but we don’t talk about that publicly)
anyways uh feel free to.. look at my posts
Hurricane Melissa’s Jamaica Landfall: The Official Estimate Versus the Data
The official landfall intensity remains 160 kt/897 mb, which constitutes an official tie for the strongest #hurricane on record in the entire Western Hemisphere. That figure, however, is simply not supported by the available evidence. In the following in-depth reanalysis, we reexamine the reconnaissance data, structural evolution, satellite trends, and surface observations to determine the absolute best single intensity estimate at the time of Melissa’s catastrophic strike on western Jamaica.
What the official (NHC) Tropical Cyclone Report requires to retain 160 kt/897 mb
To hold the official landfall intensity of 160 kt/897 mb, the TCR effectively has to:
* Carry the peak intensity profile and an exaggerated inner-eyewall pressure gradient from the final reconnaissance pass all the way to the time of landfall.
* Discount the significant satellite degradation — eye filling and progressive cloud-top warming — that became increasingly pronounced after 1500Z.
* Set aside a straightforward extrapolation of the 2 mb pressure rise already measured between the last two center fixes (892 mb adjusted at 1302Z to 894 mb adjusted at 1346Z) over just 44 minutes, which by itself reaches approximately 904 mb by 1725Z.
* Treat the New Hope (913.5 mb at 1700Z, 3.5–4 n mi from the center) and Crawford (926.0 mb at 1720Z, 4.6 n mi from the center) readings as if they were not actually taken inside the eye, despite the documented conditions at both locations.
Producing 897 mb from those surface readings requires radial pressure rises of 16.5 mb over only 3.5–4 n mi to New Hope and 29 mb over just 4.6 n mi to Crawford — gradients of 4–6+ mb per n mi inside the eye. That degree of steepness is strictly eyewall territory. Inside the eye, warm subsident air and very low tangential winds produce a near-flat pressure field. Dropsonde observations routinely show minimal inner-core gradients and approximate gradient-wind balance above the boundary layer (García-Franco et al., 2021). Recent dropsonde analyses show that inner-eye radial gradients are typically very small — on the order of 1–2 mb or less over several nautical miles.
A Reconstruction Based on Observed Data
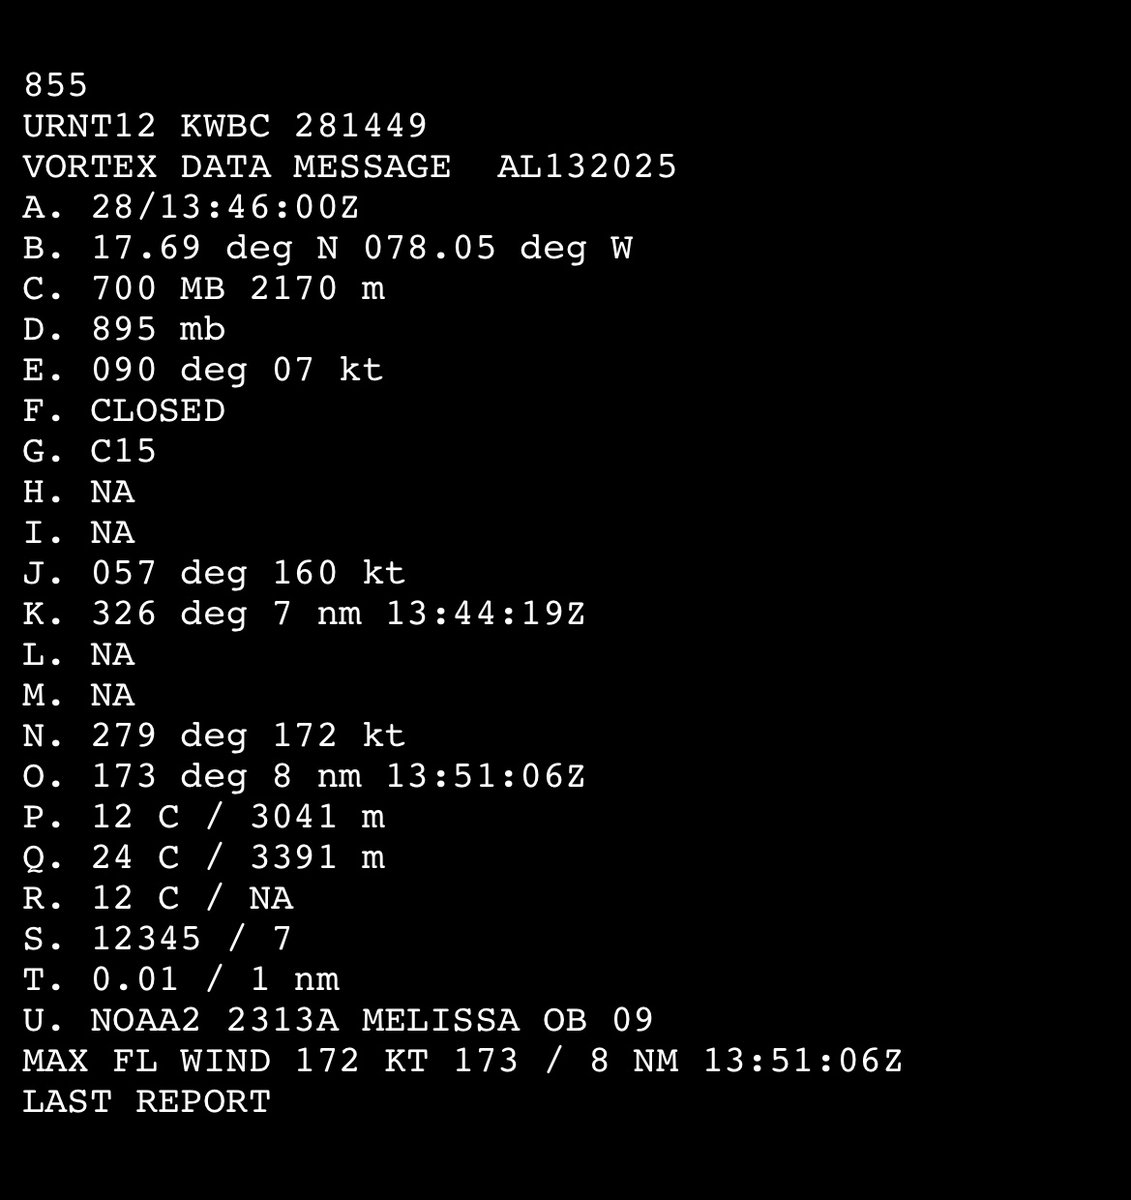
The final reconnaissance pass (ending 1346Z) established a near-flat pressure field inside an 8 n mi RMW and a central pressure of 894 mb (adjusted). The pressure had already risen 2 mb in the preceding 44 minutes (from 892 mb adjusted at 1302Z).
The TCR’s description of a 35–40 mb drop from center to the RMW over 5–8 n mi on that pass mixes two different radii: the actual wind maximum was near 8 n mi (VDM max wind 172 kt at 1351Z, dropsondes, and outbound HDOB), while the 5 n mi end of the range comes from a single inbound HDOB at 1344:30Z (extrapolated SLP of 927.7 mb at 5.4 n mi, inside the wind maximum). The dropsondes on the same pass confirm the surface wall near 8 n mi (927 mb south, 932 mb northwest). The official range therefore exaggerates the inner-eyewall gradient by treating an extrapolated pressure radius as if it were the RMW.
A peaked eyewall gradient of the magnitude actually observed demands a relatively flat inner eye — not the 16.5–29 mb rises over 3.5–5 n mi required to reach 897 mb from the New Hope and Crawford readings. Even in the record-intense Hurricane Patricia (872 mb peak), high-density dropsonde data showed inner-eye differentials of < 2 mb across comparable distances, despite eyewall gradients reaching 24 mb per n mi. Melissa’s required inner-eye variation far exceeds that precedent. As the cyclone neared landfall moving at a slow translation speed of 7 knots, Jamaica’s elevated terrain supplied an additional physical mechanism for accelerated disruption of low-level inflow that is typical in a high-end, small-core hurricane (Rogers et al., 2017).
The only direct measurements of the core in the final hour perfectly track this topographically induced filling trend. At 1700Z, New Hope Primary School recorded a surface pressure of 913.5 mb at a radar-derived distance of 3.5–4 n mi from the center. Twenty minutes later at 1720Z, the Crawford (iCyclone) sensor — positioned 4.6 n mi from the center, just inside the inner edge of the eye — registered a pressure of 926.0 mb amidst documented light-to-moderate rain and winds well below hurricane force. These ground-truth readings are mutually consistent with a rapidly degrading system and are wholly incompatible with a central pressure remotely close to the official 897 mb under the near-flat inner-eye structure documented by reconnaissance.
Maintaining a standard, near-flat inner-eye pressure field relative to the New Hope data yields a most likely central pressure of 912 mb at landfall. This satisfies a realistic 1–2 mb gradient across the eye floor and places Crawford right at the naturally steepening inner boundary of the eyewall. While standard wind-pressure relationships (WPR) might suggest lower wind speeds for a 912 mb storm moving at a slow 7 knots, Melissa’s extreme core contraction — with an RMW of only 8 n mi — allowed it to maintain an exceptionally high pressure gradient parameter even as the storm filled, enabling it to sustain 150 knot Category 5 winds right up to the coast.
However, a central pressure as low as 910 mb can’t be entirely ruled out as an absolute floor of physical plausibility. As the southern and eastern eyewall scraped the rugged terrain, severe boundary-layer friction likely induced localized, asymmetric compression of the internal gradient on the peripheral edge of the eye where Crawford was situated. This land-induced asymmetry can account for a steeper localized gradient to bridge a 910 mb center to Crawford, without requiring a pristine, ultra-intense 897 mb core configuration. Therefore, while 910 mb represents the baseline's floor, a value of 912 mb/150 kt stands as the most consistent, elegant, and mathematically supported estimate for Melissa’s landfall.
Hourly Satellite Analysis (BD-Curve Infrared Imagery)
(See the close-up four-panel IR sequence attached to the quoted post for the progression through landfall.)
1200Z (Near Peak)
The eye is clear and small, with a very well-defined round circular shape. Immediately surrounding the clear center is a tight, symmetrical sequence of very narrow color strips (blue, yellow, light red/dark orange, and black). These mark the steep temperature gradient at the edge of the eye and the innermost portion of the eyewall. Beyond the black strip lies the broader Central Dense Overcast (CDO), which is dominated by white and a light gray shading with intermixed pink areas. The pink marks the coldest cloud tops contained within the CDO.
The overall structure is tight and continuous, with no noticeable intrusion of the warmer colors into the eyewall region or CDO. In short, this is the classic appearance of a high-end Category 5 at or near maximum intensity.
1300Z
The eye remains clear, small, and well-defined. The innermost color strips (blue, yellow, light red/dark orange, and black) are still tight and symmetrical. The primary change from 1200Z is modest warming within the surrounding CDO: the white shading immediately outside the black eyewall strip has expanded into more light gray. Pink areas are still present, but slightly less continuous in the innermost CDO. This is a subtle early indication of the beginning of structural decline, consistent with the 2 mb pressure rise measured between the final reconnaissance fixes.
The overall presentation, however, remains that of a high-end Category 5.
1400Z
The eye remains clear and well-defined. The innermost color strips are still present and remain relatively tight. Further warming is now visible in the CDO immediately outside the eyewall. Darker gray tones have developed closest to the black strip, and the light gray has expanded outward. This is the first noticeable encroachment of warmer colors toward the eyewall region.
These changes are consistent with the aforementioned weakening observed between the final reconnaissance fixes (1302–1346Z) and marks the beginning of more evident structural decline from the peak presentation.
1500Z
The eye remains well-shaped, but has continued to become less sharply defined than at peak. The innermost color strips have begun to lose definition: the red ring has expanded and overtaken portions of the black band, and warmer tones are appearing closer to the eye. In the surrounding CDO, warming has also continued. Darker gray tones have expanded around the eyewall region, with intermixed black splotches. The light gray has become even more extensive.
This represents a clear continuation of the structural decline that began after 1300Z, featuring the first evident degradation of the eyewall color strips themselves.
1600Z
The eye remains relatively well-shaped, but has lost further definition. The innermost color strips outside the blue and yellow have warmed substantially: black has overtaken much of the previous red, red has moved into the former black band, and black has replaced darker gray farther outward in the CDO. Warming of the surrounding CDO has continued, with darker gray and black tones more extensive around the eyewall region.
This interval coincided with the outer edge of the eyewall first reaching the western Jamaican coast around 1515Z. The topographically driven structural decline is now well established.
1700Z (Final Approach)
As the eye makes its final approach and the RMW in the northeastern eyewall moves onshore over southwestern Jamaica, the satellite presentation shows far more dramatic deterioration. The eye has lost significant definition and shape; it is smaller and more cloud-filled. Warming has continued throughout the CDO and is most pronounced in the eyewall region. Each of the color strips immediately around the eye has warmed, with the colors bleeding into one another. None retains a solid, well-defined strip. The red band that was once tight and continuous is now significantly distorted.
This marks a clear acceleration of the structural decline as the core heavily interacts with the coastline.
1725Z (Landfall)
During the final 25–30 minutes prior to landfall, the weakening further accelerated. The eye has contracted further and is increasingly cloud-filled. Its once well-defined and symmetrically circular shape is now noticeably distorted. The same pattern of progressive warming has continued: the innermost color strips have lost additional definition, and warmer tones have expanded further into the eyewall and innermost CDO.
The presentation at landfall is substantially degraded from the peak structure at 1200Z and is completely consistent with the continued core filling indicated by both the New Hope and Crawford eye surface readings.
Hourly intensity estimates
Based on the reconnaissance pressures, the measured filling rate, the progressive satellite degradation, and the eye surface readings:
* 1200Z: 165 kt/891 mb
* 1300Z: 165 kt/892 mb
* 1400Z: 165 kt/895 mb
* 1500Z: 160 kt/898 mb
* 1600Z: 155 kt/902 mb
* 1700Z: 150 kt/907 mb
* 1725Z (landfall): 150 kt/912 mb (plausible localized range down to 910 mb)
As seen, there is simply no possible basis for the official landfall intensity of 160 kt/897 mb. Every independent piece of evidence available after the final reconnaissance passes indicates progressive, significant weakening. The data that exist leave no other conclusion: #Melissa underwent pronounced inner-core weakening and made landfall well below its historic peak.
Rolling Stone reveals their top rock songs of the 21st century.
1. “Maps” - Yeah Yeah Yeahs
2. “Seven Nation Army” - The White Stripes
3. “Mr. Brightside” - The Killers
4. “good 4 u” - Olivia Rodrigo
5. “The National Anthem” - Radiohead
6. “I Know The End” - Phoebe Bridgers
7. “Last Nite” - The Strokes
8. “99 Problems” - Jay-Z
9. “I Bet You Look Good on the Dancefloor” - Arctic Monkeys
10. “Impossible Germany” - Wilco