https://t.co/bez1peI9m4
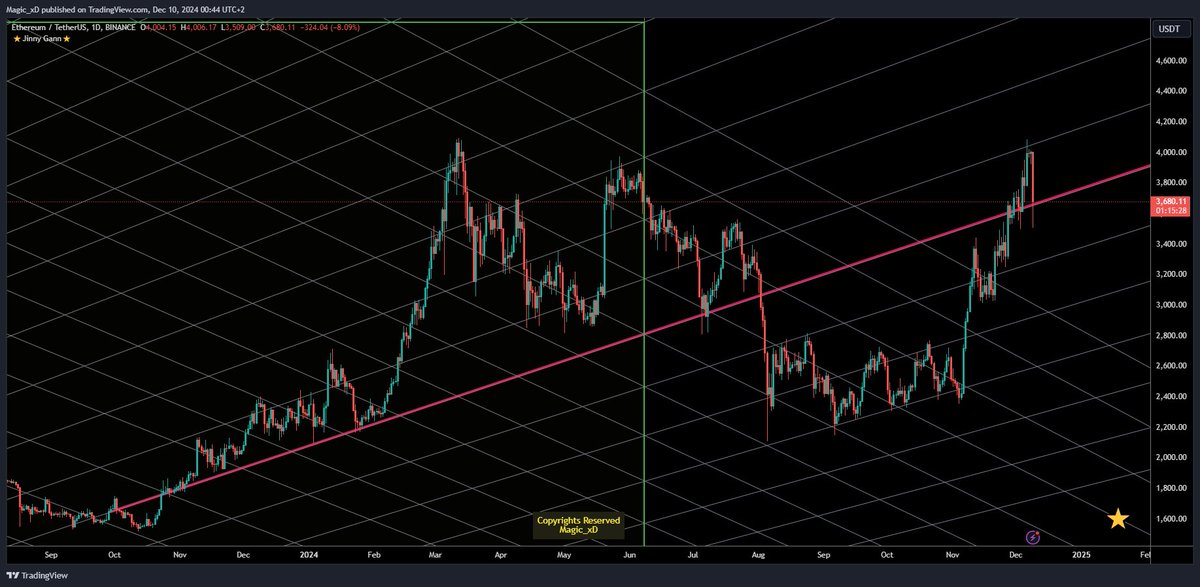
Gann chart for ETH/USDT, showcasing key support and resistance levels based on Gann angles and square values. These levels can act as critical turning points for Ethereum's price movement.
Bitcoin (BTC/USDT)
Bitcoin is currently trading around 57,660 USDT after a bounce from lower levels.
Support zones are visible around 55,933 USDT and 53,593 USDT.
Resistance levels can be seen around 58,323 USDT and 60,763 USDT.
#Bitcoin
https://t.co/QnP4XT1vfk
https://t.co/cMh2QtRHBf
Analyzing the US 500 Index on a weekly time frame using Gann-based techniques. Key resistance levels are marked at 5,673.7, 6,057.0, and 6,253.0, while support levels are identified at 5485 and 5,304.5
The index is currently testing resistance at 5,673.7